

Despite a resilient start to the year and a surge to new highs, ETH is now under the microscope as investors assess the potential for a broader market downturn and the possible catalysts for renewed upside momentum.
 Ethereum price chart: Key zones for August 2025
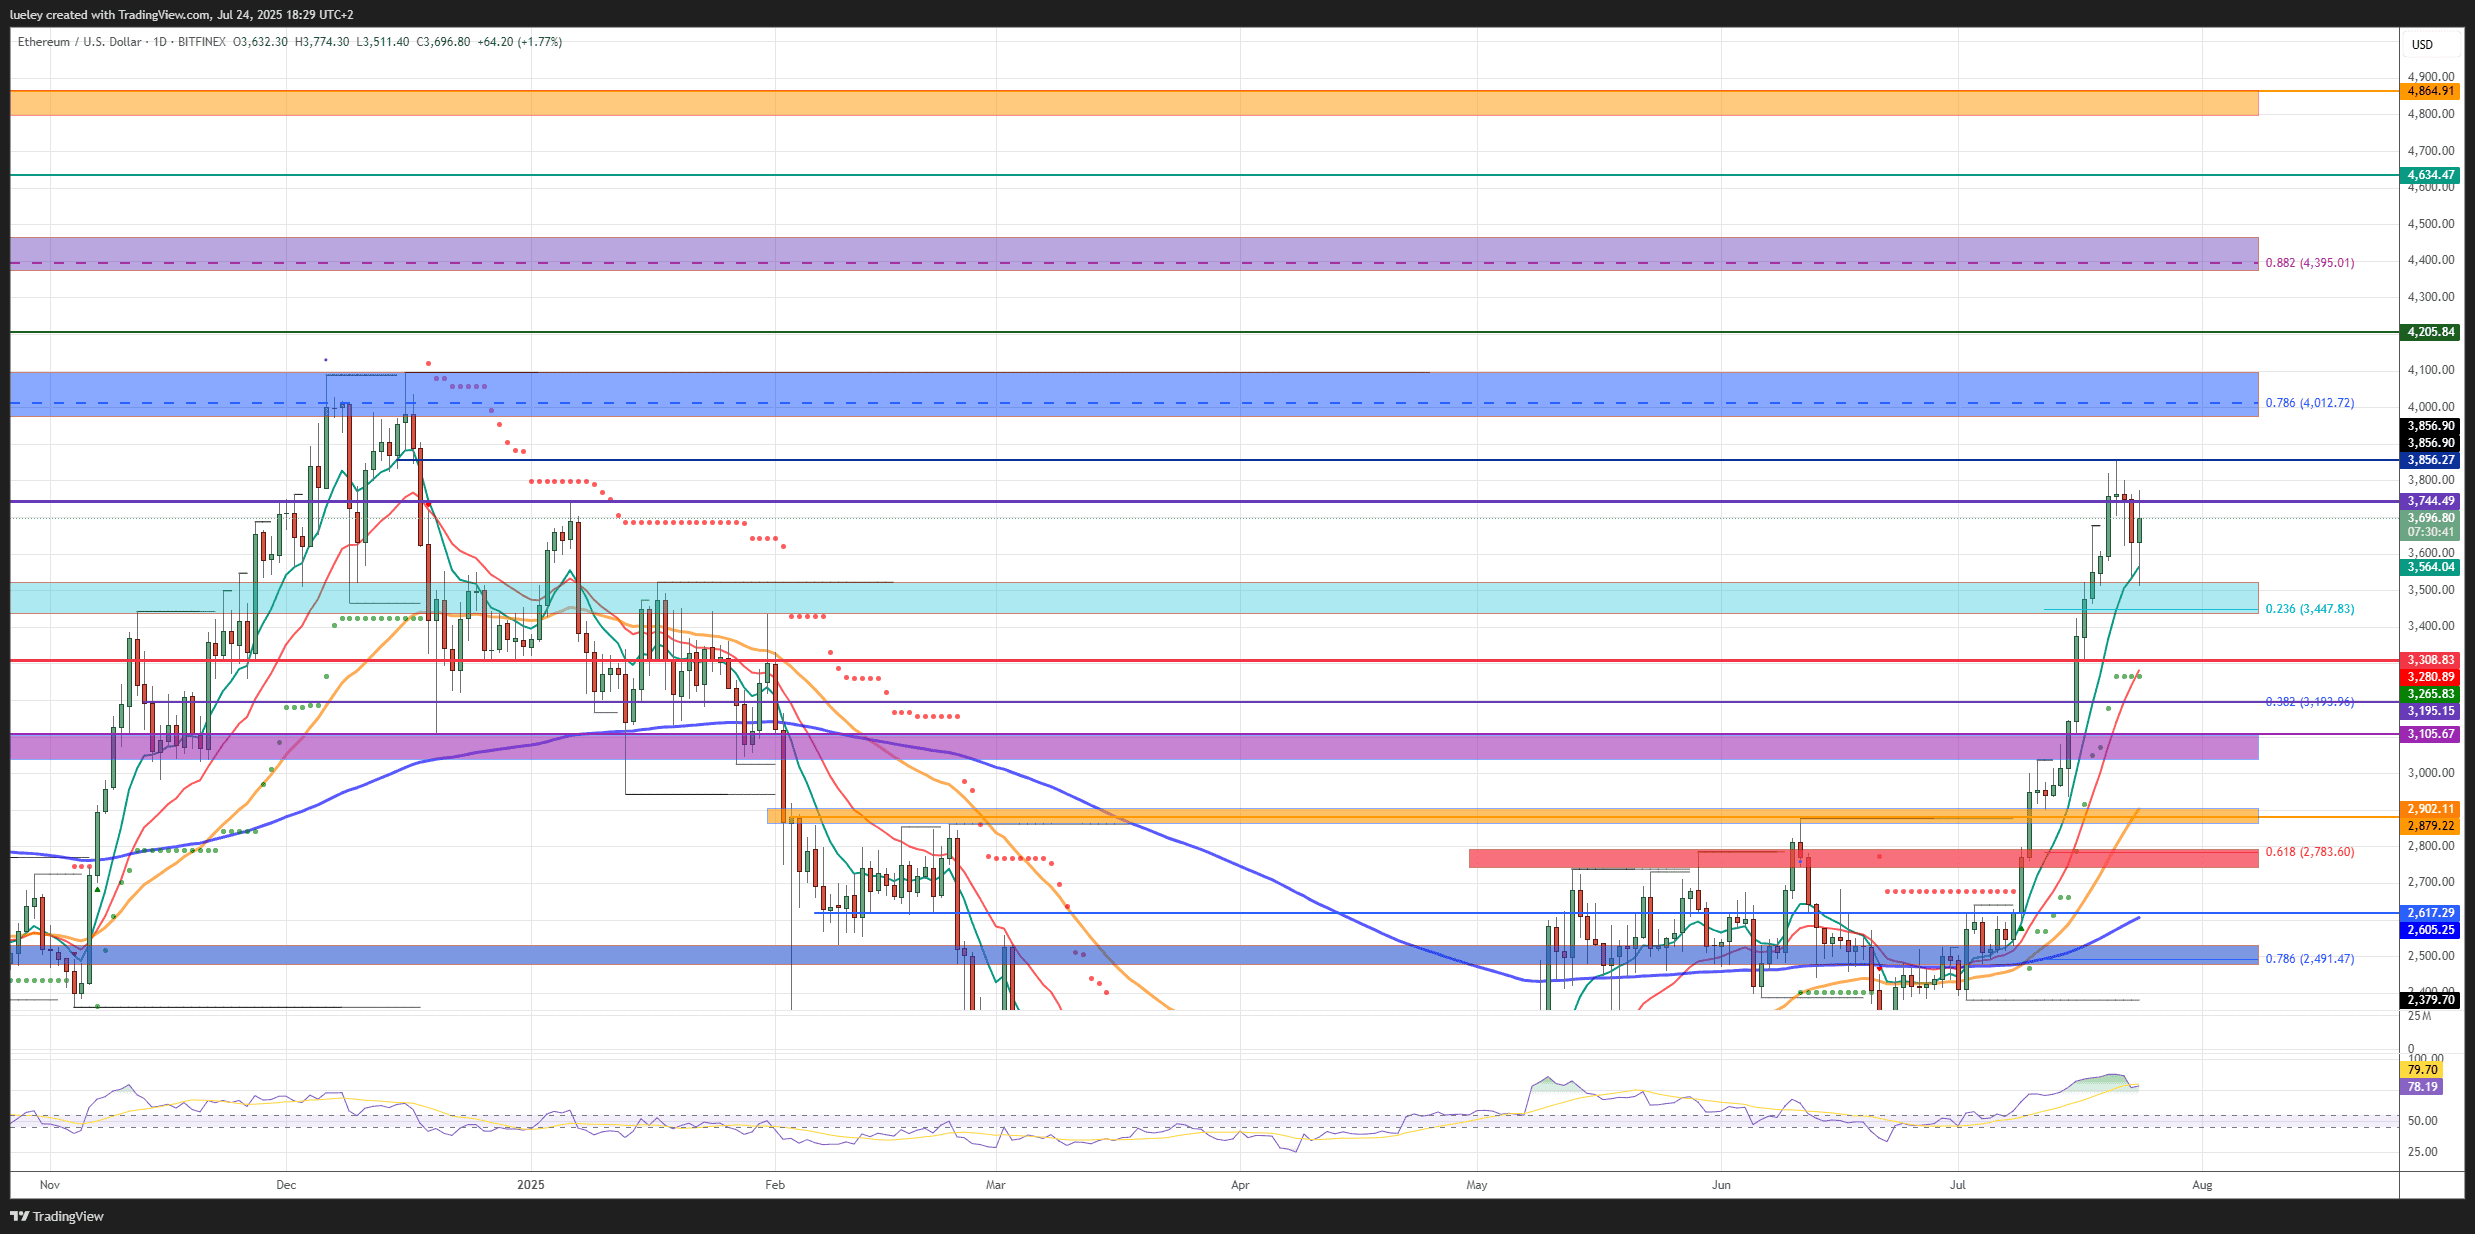
Market Overview: From New Highs to Correction
Last week, Ethereum surged to a new annual high at $3,856, marking a strong upward trend. However, this rally was short-lived, with the price facing a swift pullback of roughly 9%, consolidating near $3,511 before partially recovering to around $3,742 at the time of writing. This volatility followed a wave of profit-taking after the rally, with technical signals such as the RSI indicator hitting 88—a level not seen since 2021 and indicating extreme overbought conditions.
Despite this short-term setback, Ethereum still posted a 7% weekly gain, outperforming many large-cap cryptocurrencies. The current correction phase is widely seen as a necessary cooling-off period after the strong impulse move. Notably, ETH’s price action has mirrored similar patterns observed in Bitcoin, reinforcing the interconnectedness of major digital assets.
Why the Correction Could Deepen — or Reverse
Several factors underpin the present phase of market consolidation. Notably, the liquidation heatmap showed a spike in forced liquidations for leveraged long positions, with over $151 million in ETH longs wiped out in just 24 hours, compared to about $64 million for Bitcoin. This deleveraging cycle has historically marked inflection points and often sets the stage for renewed accumulation—if critical supports hold.
The spot Ethereum ETF story remains central to the mid-term narrative. Wall Street’s appetite for direct ETH exposure continues to grow, with institutional treasuries increasingly allocating to ETH, fueling optimism about a sustainable recovery. However, technicals must align: the bulls’ immediate priority is defending the EMA9 (around $3,447), which coincides with the 23% Fibonacci retracement and serves as a short-term pivot for market sentiment.
Technical Landscape: Support and Resistance Zones
Key support levels: The $3,744 region, now acting as resistance after the correction, and the EMA9 at $3,447 are pivotal. If bulls maintain price action above these zones, a move back to the yearly high at $3,856 could materialize quickly. Otherwise, the next significant support lies at the EMA20 (red) near $3,308. A breach of this level could usher in a deeper retracement toward $3,193—the 38% Fibonacci retracement—and potentially as low as the mid-$3,100s.
Key resistance levels: Immediate resistance is clustered at $3,744 (prior high) and $3,856 (yearly peak). Above these, the next upside targets are in the $3,975–$4,096 corridor, with $4,012 aligning with the 78% Fibonacci retracement. Should ETH break through, further resistance emerges at $4,205 and the broader $4,373–$4,464 area, representing the last technical hurdles before retesting the 2021 all-time highs.
Bullish Scenario: What Could Ignite a New Rally?
Ethereum retains its underlying bullish structure so long as it trades above the critical $2,902 support. If bulls regain control and drive the price above $3,744, a retest of the yearly high at $3,856 becomes likely, followed by a challenge of the psychologically important $4,000 level. This region is historically contested, with both buyers and sellers defending their positions.
Institutional accumulation remains a wild card: more than 600,000 ETH are currently queued for de-staking, suggesting the potential for both selling pressure and renewed staking interest. If price action decisively breaks above the $3,975–$4,096 resistance band and closes the week above this zone, it may open the door for a sustained rally targeting $4,205 and ultimately $4,464. Such a scenario would revalidate the bull case and may even revive calls for new all-time highs.
Bearish Scenario: Signs of a Larger Correction?
The bears have delivered an initial blow, but have yet to break Ethereum’s overall structure. Failure to reclaim $3,744 increases the probability of another test of the EMA9 at $3,447. A daily close below this support, especially if confirmed by heavy volume, could lead to a retest of $3,308 (EMA20). If neither of these holds, the $3,193 Fibonacci level and the $3,105–$3,195 zone become the next battleground, especially if ETF regulatory decisions are delayed or macro sentiment weakens.
In a deeper drawdown scenario, ETH could slide toward $3,000, aligning with the EMA50 (orange). This region—specifically between $2,905 and $2,862—historically attracts fresh buying. A breakdown below these supports, however, may extend losses to the $2,783–$2,744 area, the so-called “golden pocket” for this correction phase. Such moves are rare and would likely require a significant deterioration in risk sentiment or a new wave of regulatory headwinds.
Market Indicators: RSI, Volume, and On-Chain Activity
The RSI on the daily chart remains elevated at 78, underscoring persistent overbought conditions. On the 4-hour chart, the RSI has already returned to neutral territory, suggesting some short-term relief is possible. Importantly, the RSI on the monthly chart has just generated a new buy signal, often preceding medium-term rallies. Trading volume surged during the recent correction, supporting the case for a healthy market shakeout rather than the onset of a sustained bear phase.
On-chain activity supports this view: despite outflows from overleveraged traders, ETH continues to see robust network activity and elevated staking interest. These factors historically underpin price resilience during broader market corrections.
Ethereum Spot ETFs: Catalyst or Headwind?
The introduction and growing popularity of Ethereum spot ETFs is arguably the most influential macro driver for ETH price dynamics this year. Inflows into these products have exceeded $8 billion since launch, with asset managers and institutional investors steadily increasing allocations. Approval of staking options for these ETFs remains a key narrative for the remainder of 2025; any delays or regulatory setbacks could temporarily sap market confidence, while progress on this front would likely amplify bullish momentum.
Regulatory clarity is also on investors’ radar. Ongoing decisions by the US SEC, especially regarding BlackRock’s staking proposal, have the potential to cause short-term volatility. A positive ruling could trigger immediate upside, while prolonged delays or negative outcomes would weigh on ETH in the coming months.
Conclusion: Volatility to Persist, But Structure Remains Bullish
Ethereum’s current price structure is a textbook example of a high-beta asset in a consolidation phase. The next two weeks are pivotal: holding above $3,447 keeps the door open for a new rally, while failure to defend this zone could usher in a deeper retracement. Long-term investors remain focused on ETF flows, macroeconomic data, and the outcome of regulatory debates.
For traders and institutional players, the coming sessions will likely provide critical signals. A decisive break above $3,856 reactivates the bull trend, while a drop below $3,308 signals caution. In either case, Ethereum continues to cement its status as the key altcoin to watch, both as a bellwether for the crypto market and a core holding for diversified portfolios.