

Key Technical Target: $0.4334
A standout upside target now lies at $0.4334—a zone of historical imbalance created by a rapid previous sell-off. Technically, these untested price areas often act as magnets, drawing price action back for a retest.
Heatmap data highlights multiple liquidity clusters just above current price, suggesting that if the bullish momentum continues, these levels could be targeted next. With only weak resistance ahead, a swift move toward the $0.4334 imbalance appears plausible.
The RSI sits at 65, keeping TRX out of the classic overbought zone, leaving room for further upside. MACD remains neutral: neither strong buy nor sell signals are present, but a momentum shift in favor of bulls could accelerate the trend.
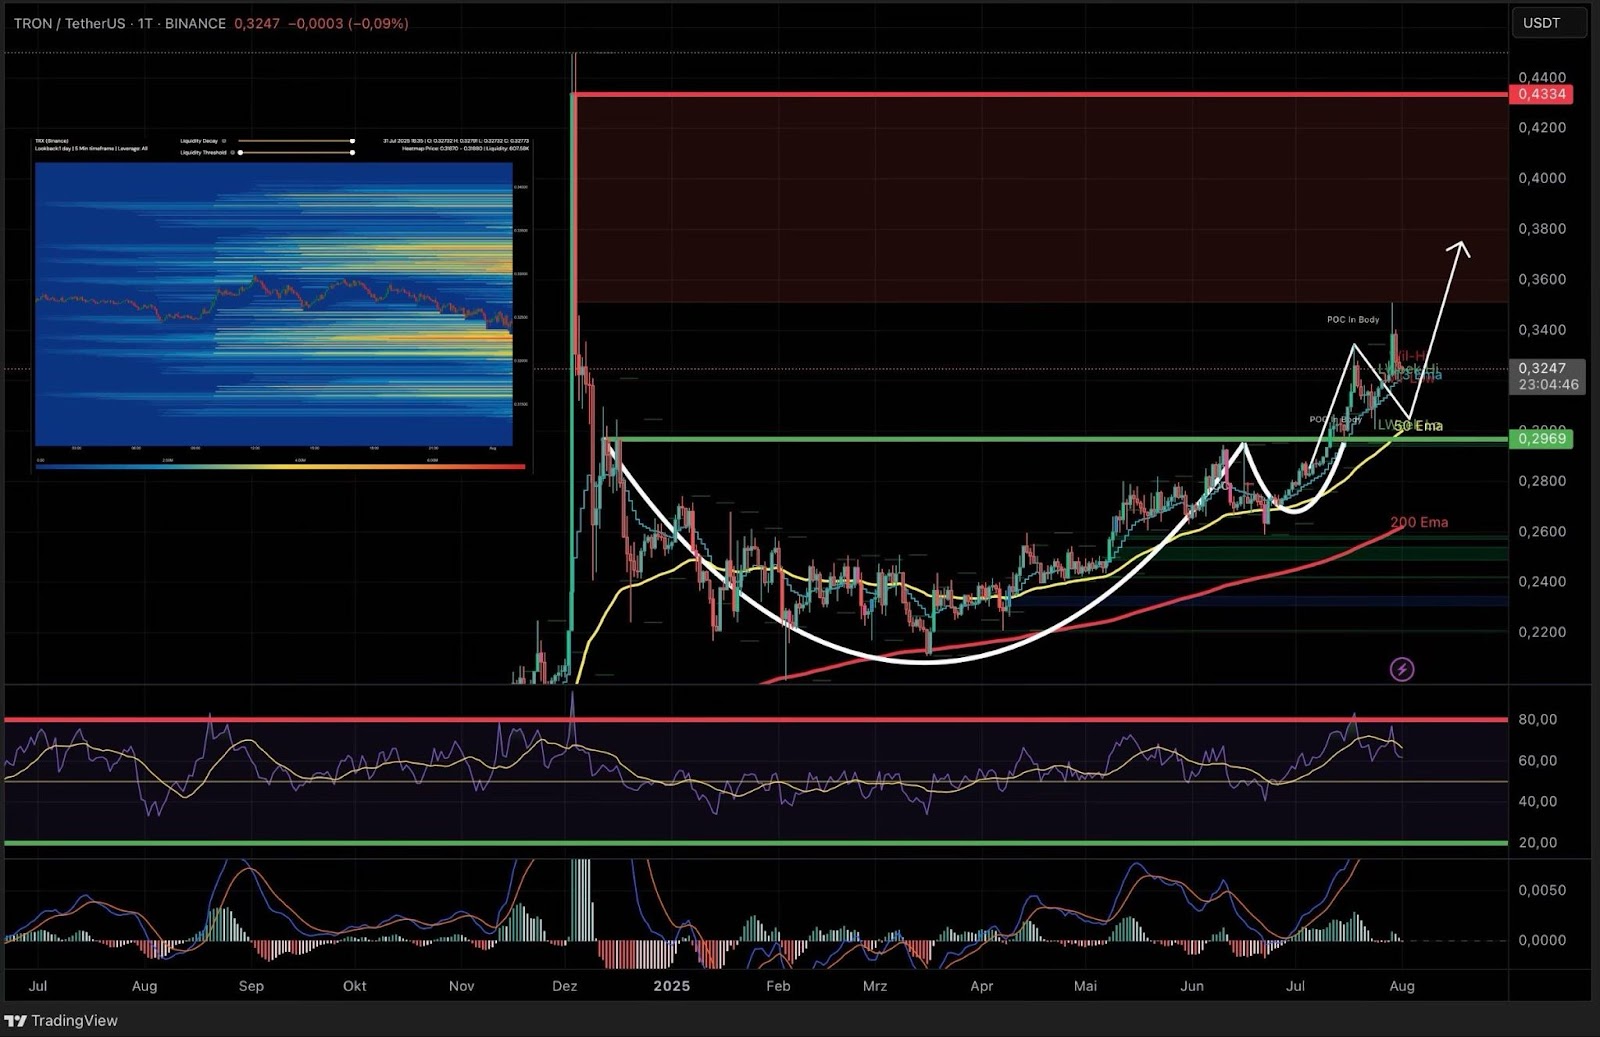 TRX daily: Cup & Handle breakout targets $0.4334. TradingView
Despite the constructive technical picture, overall market sentiment remains critical. A significant break of Bitcoin support could still undermine TRX’s bullish structure, even if TRX itself remains technically healthy.
4-Hour Chart: EMA Structure and Short Liquidations in Focus
The 4H chart shows a resilient short-term uptrend. The 50 EMA has provided dynamic support, repeatedly sparking fresh upside after each retest. As long as TRX holds above this level, the short-term structure remains bullish. If lost, the 200 EMA becomes the next focus for buyers.
Below that, a key horizontal support—marked by previous major buying interest—could come into play.
Current liquidation data reveals heavy short positioning above market. A break above recent highs could trigger a short squeeze, amplifying bullish momentum as shorts are forced to cover.
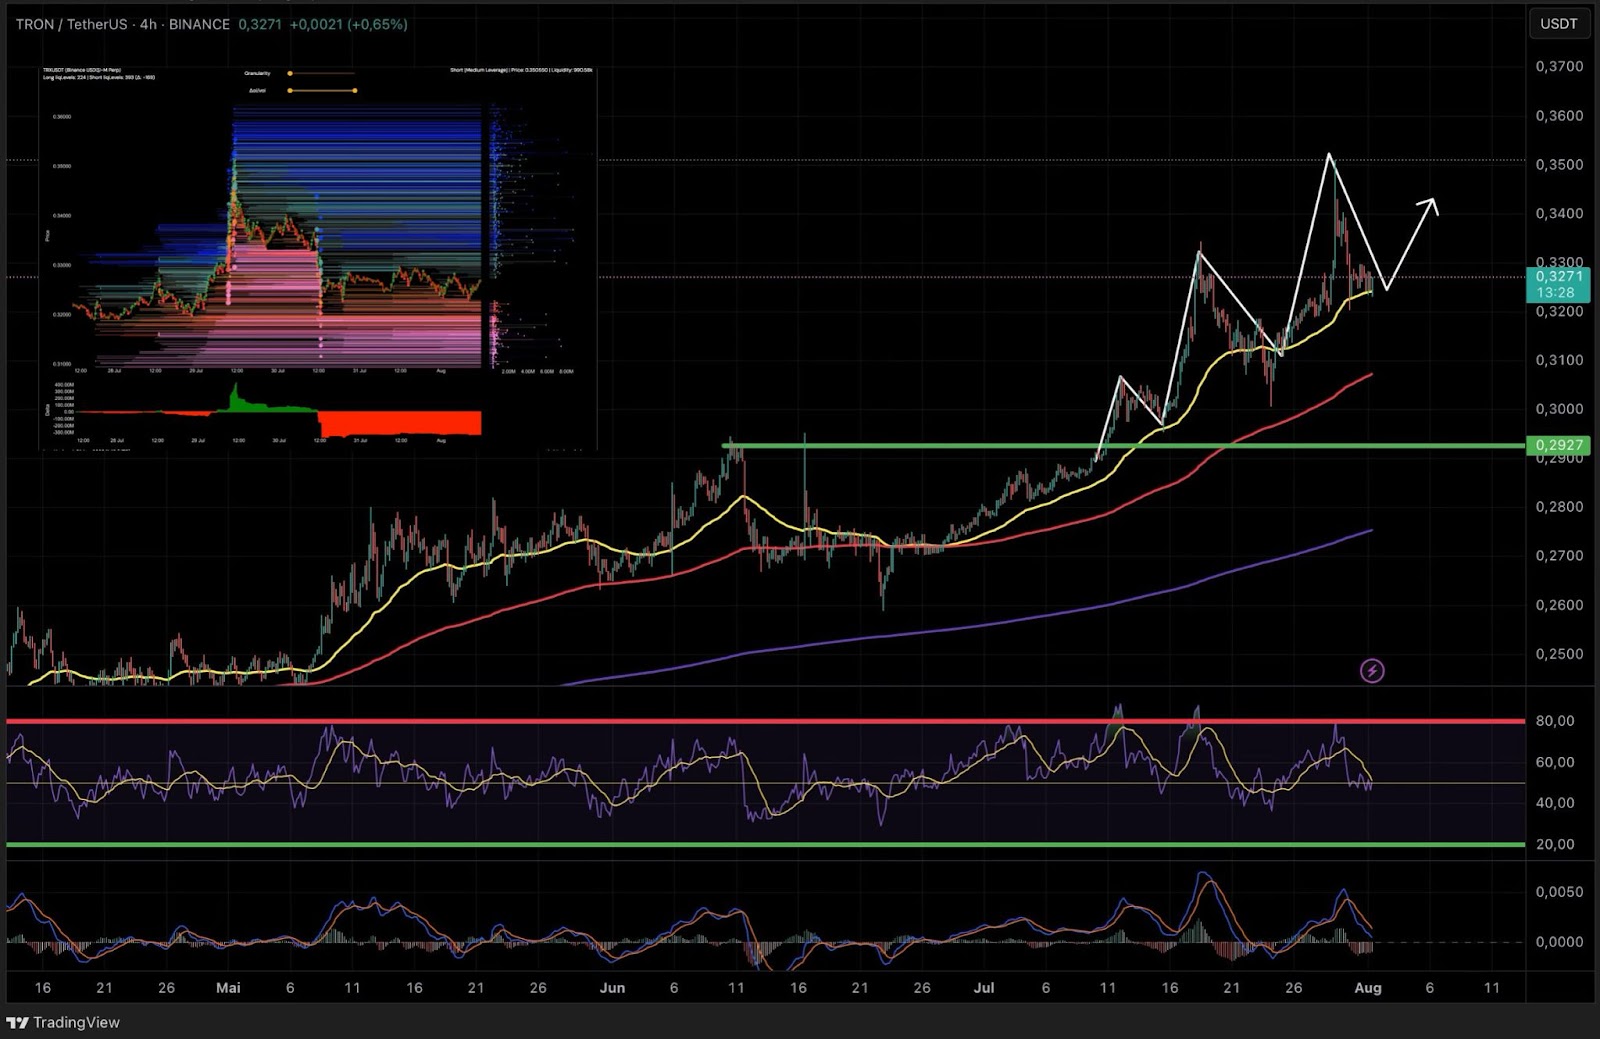 TRX 4H: EMA zones and short liquidation levels. TradingView
Summary & Outlook
Tron (TRX) continues to build a bullish structure, with clear technical targets and robust support zones on both daily and intraday timeframes. As long as Bitcoin avoids a decisive breakdown, TRX remains poised for further gains—especially if MACD momentum strengthens and a short squeeze materializes above local highs.