

Altcoin Cardano (ADA) currently finds itself at a pivotal point, with the daily chart reflecting a technically constructive—though not unshakeable—setup. After carving out a pronounced W-formation, the price is once again challenging the neckline zone between $0.82 and $0.84, a region acting as a crucial decision point for the short-term trend.
As long as ADA trades above the ascending yellow trendline, the broader technical structure remains bullish. However, a break beneath this trendline would heighten the likelihood of a pullback, potentially targeting the 50-day and 200-day EMAs, which serve as immediate support levels.
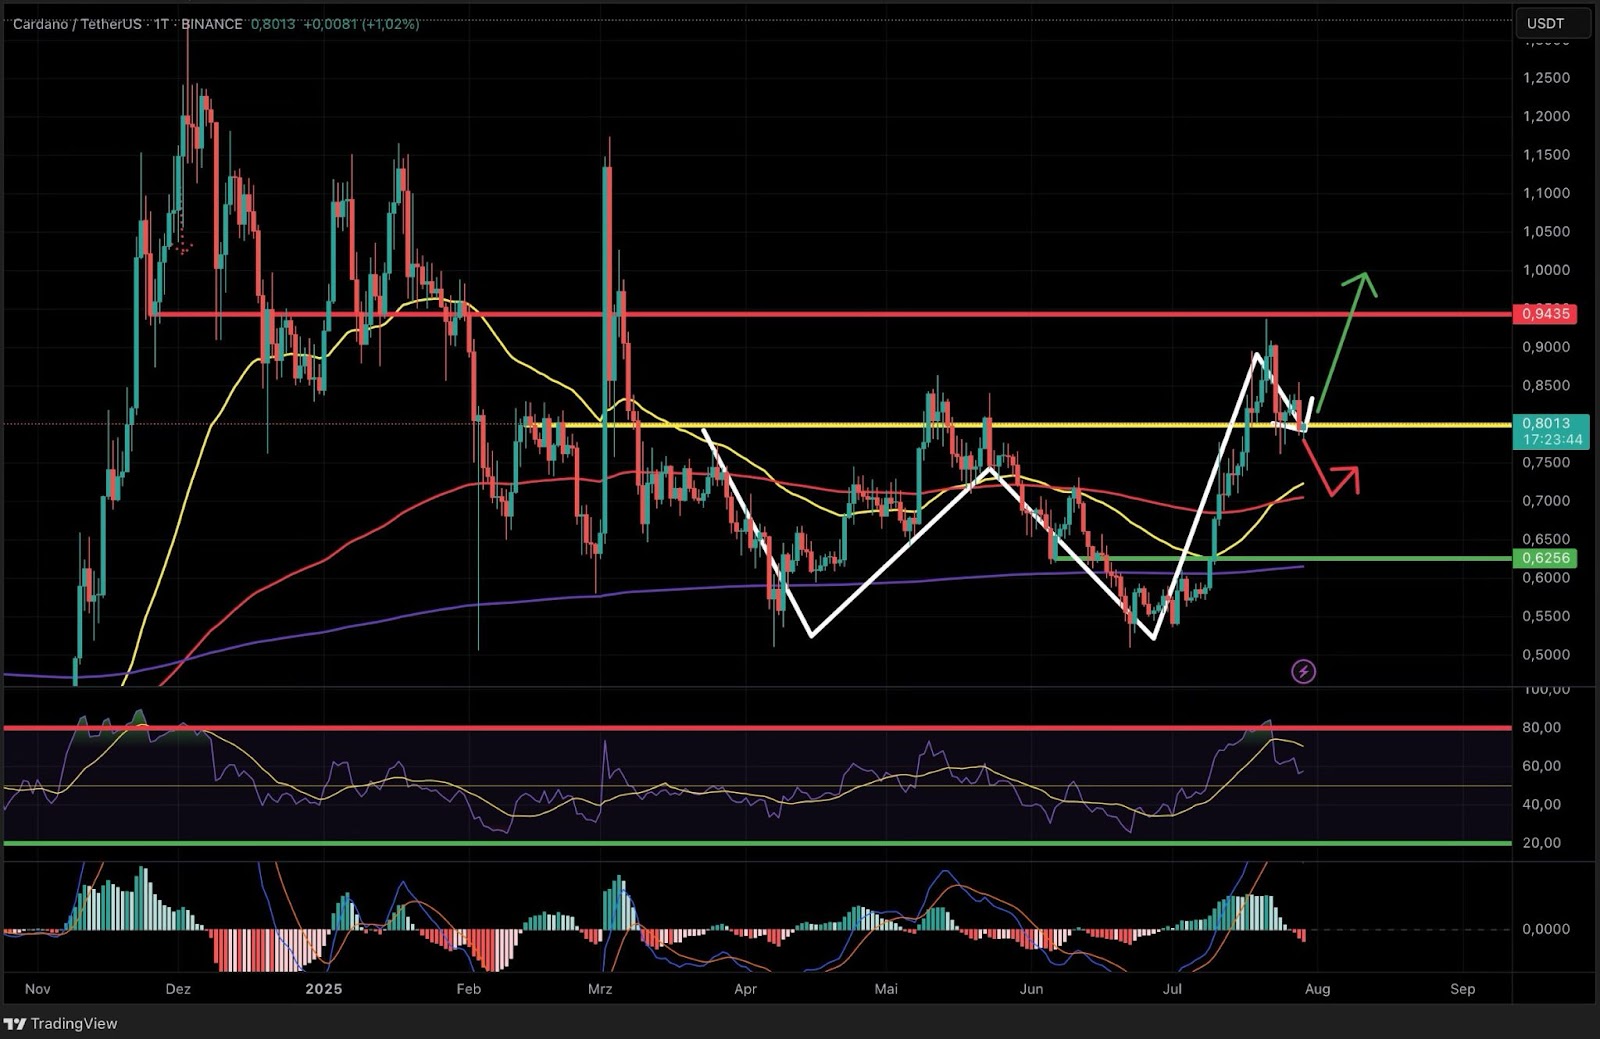 Cardano price action at key technical levels. TradingView
Technical Indicators Signal Cooling Momentum
The current constellation of indicators paints a nuanced picture: the Relative Strength Index (RSI) remains comfortably above the 50-point threshold, indicating market structure is intact. The MACD is modestly negative, yet downward momentum appears to be waning, suggesting that ADA is undergoing a healthy consolidation phase.
Sideways price action over the next several days would further stabilize technical equilibrium, reducing the risk of a deeper breakdown.
4-Hour Chart: Awaiting the Next Move
On the 4-hour timeframe, Cardano broke out convincingly above a key green support zone in mid-July, which has since transformed into a robust technical floor. Price action subsequently rallied to the $0.93 resistance area before entering a mild correction.
ADA is now consolidating within a tight range between resistance at $0.82 and support at $0.78. Notably, this sideways action is unfolding above the recently reclaimed support, signaling ongoing stability.
From a chartist’s perspective, the confluence of horizontal resistance at $0.82 and the descending yellow trendline creates a dual barrier. Breaking above this range would brighten the outlook, opening the door for renewed bullish momentum. Conversely, failure to hold the lower boundary—particularly if the 50-EMA morphs into resistance—could expose ADA to further downside toward the 200- and even 800-EMA levels, a potential sign of structural weakness.
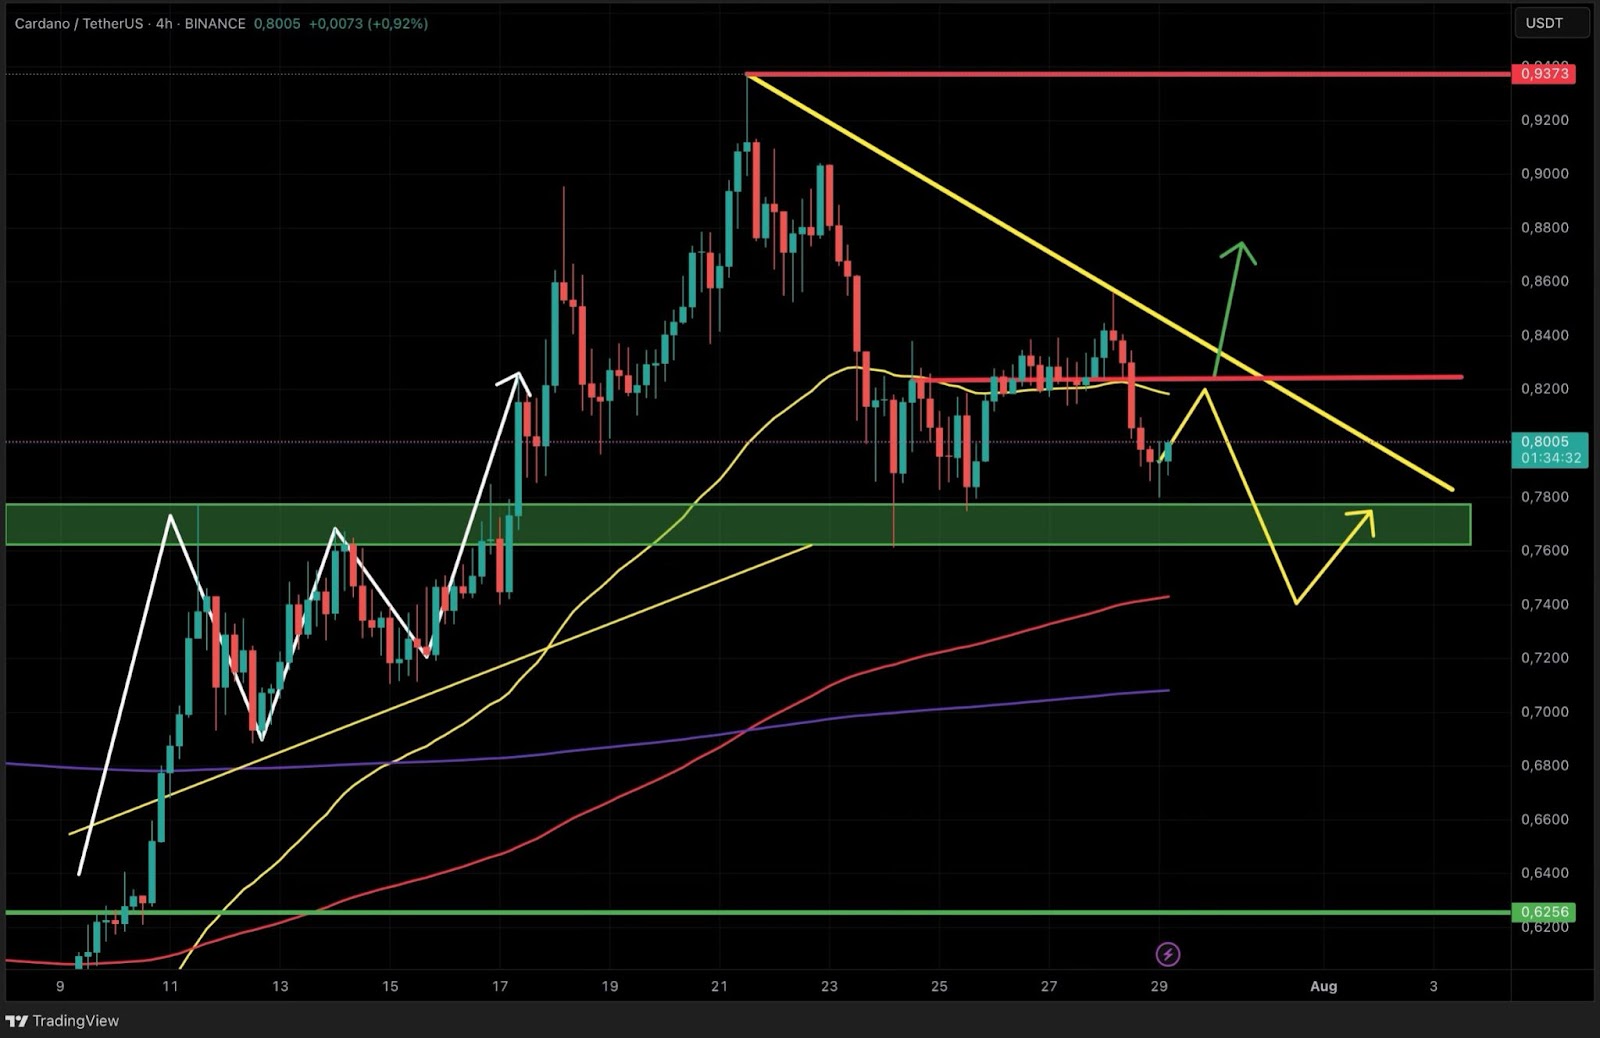 ADA consolidates, prepares for next move. TradingView
Key Price Levels to Watch
- Critical Resistance: $0.82–$0.84 (neckline); breakout target $0.94 and above
- Key Supports: $0.78 (green box); further down: 50-EMA, 200-EMA, and 800-EMA zones
Should ADA decisively clear $0.94, a pro-cyclical buy signal would be triggered, potentially unleashing the next bullish leg. Conversely, rejection at resistance increases the likelihood of a pullback toward lower support areas, particularly if price action is pressured by major moving averages. These upcoming sessions will likely determine ADA’s near-term directional bias.