

Uptrend Still Intact
Last month’s rally was supported by Chainlink’s partnership with ICE, parent of the New York Stock Exchange. In addition, the U.S. Commerce Department’s initiative to publish economic data in a decentralized format underscored the relevance of LINK’s oracle services. Despite the latest pullback, the broader trend remains positive. A stabilization at current levels followed by a recovery above the 20-day EMA would bring resistance at $26.85–$27.35 back into focus. On the downside, the confluence of the 50-day EMA and the 61% Fibonacci retracement around $21.17 provides a key defensive line.
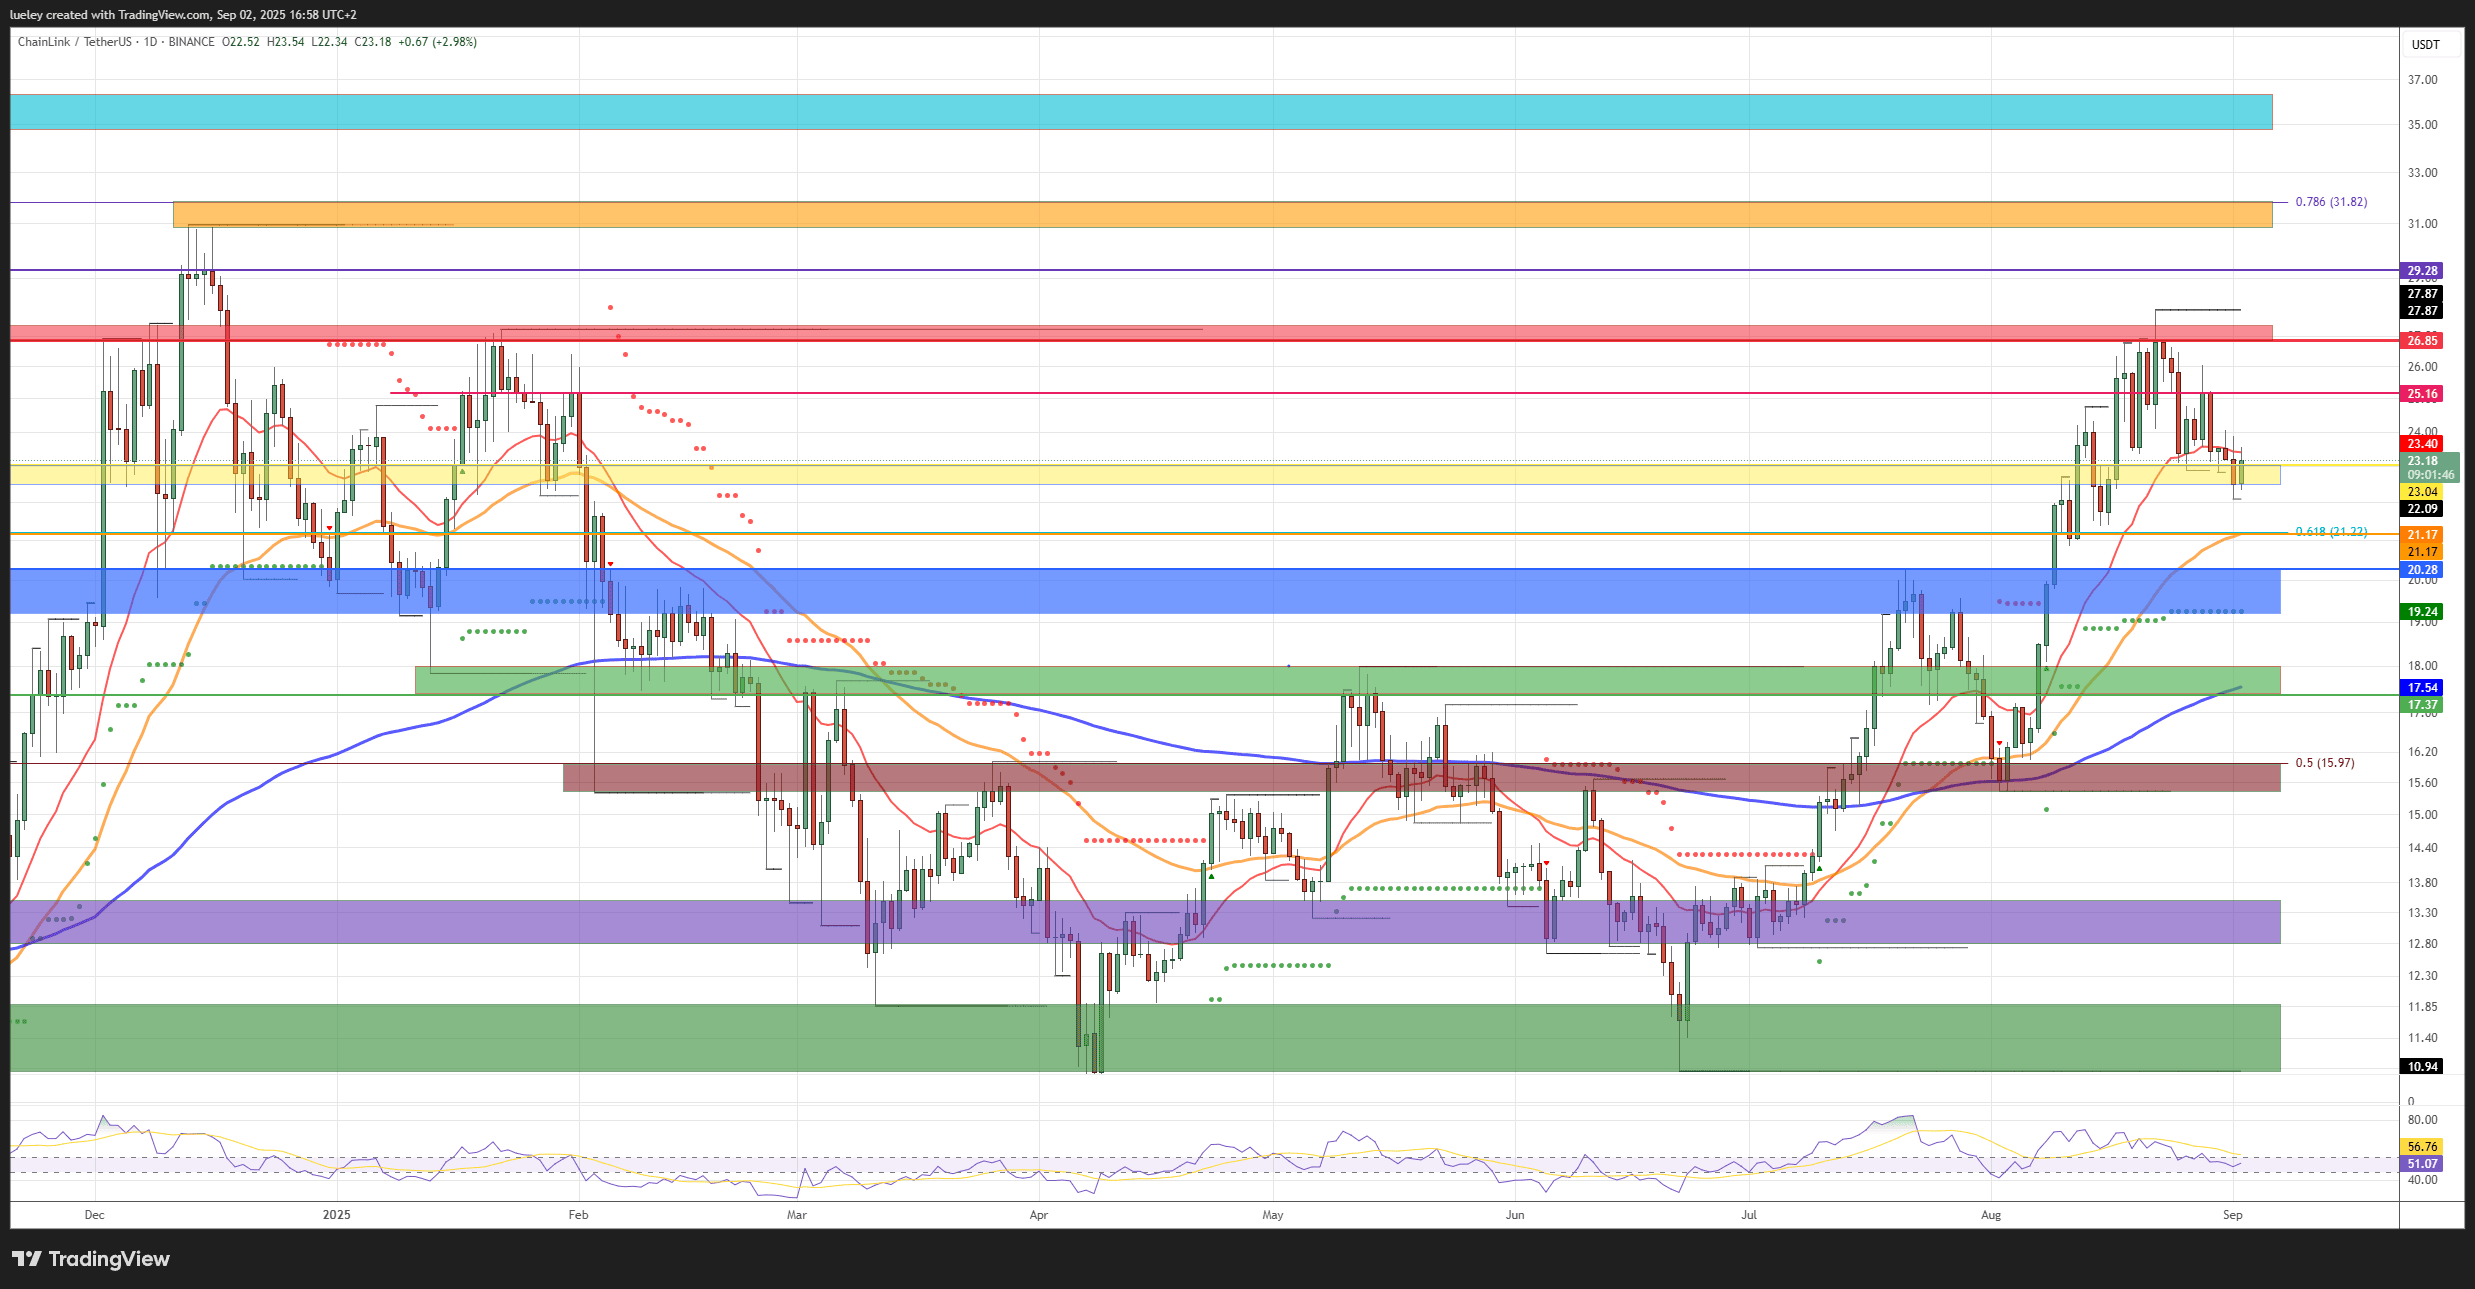
Bullish Targets: $23.36, $25.16, $26.85–$27.35, $29.28, $30.87–$31.85, $34.78–$36.33
Bullish Outlook for Coming Weeks
Although LINK retreated from its peak alongside the broader market, the token has shown relative strength compared to peers. To keep the path toward fresh yearly highs open, bulls must first reclaim $23.36. That would create room for a test of $25.16, with the $26.85–$27.35 resistance zone following soon after. If buyers succeed there, a push toward $29.28 could be next. Beyond that, the $30.87–$31.85 range — featuring last year’s high and the 78% Fibonacci retracement — stands as a tougher hurdle. Clearing this zone would greatly improve the odds of continuation toward the maximum bullish target of $34.78–$36.33.
Bearish Scenarios
Bearish Targets: $23.03–$22.50, $21.17, $20.28–$19.20, $17.99–$17.37, $15.97–$15.43, $13.50–$12.80
If sellers manage to cap LINK below the EMA20 or at $25.16, a sell-off into the $22.50 zone could follow, with the EMA50 at $21.17 as the next stop. Continued weakness may trigger a deeper correction into the $20.28–$19.20 zone — a pivotal level in past trading. Should this support fail, downside risk opens toward the $17–$15 range, with the maximum bearish extension stretching to $13.50–$12.80. Still, given Chainlink’s strong fundamentals and constructive chart setup, a decline of that magnitude appears less probable, with dips likely to attract buyers.
Indicators
On the 4-hour chart, the RSI is showing a mild bullish divergence, and a move back above 55 would support further upside. On the daily timeframe, the indicator is consolidating in the neutral 45–55 range; breaking out of this channel would strengthen the bullish case. On the weekly chart, RSI remains above 60 and continues to flash a long signal, aligning with the overall constructive outlook for Chainlink.
