

A faster directional move should be expected only after a decisive breakout from the current consolidation. The key resistance zone for bulls remains at 107.40–112.50 (61.8% Fibonacci retracement, Murray level [4/8]). A sustained move above this area could act as a catalyst for a rally toward 150.00 (Murray level [8/8]) and 162.50 (Murray level [+1/8], 38.2% Fibonacci retracement). If the price breaks below 75.00 (Murray level [2/8], lower Bollinger Band), bears are likely to take control, opening the way toward 50.00 (Murray level [0/8]) and 25.00 (Murray level [–1/8]).
Technical indicators provide mixed signals. Bollinger Bands have flattened after a decline, the Stochastic oscillator is turning upward, while the MACD histogram is contracting but remains in negative territory. As a result, SOL/USD may continue to trade within the 91.00–75.00 range in the near term. However, on the weekly chart, Bollinger Bands are still pointing downward and the MACD histogram is rising below zero, confirming that the broader downtrend remains intact. In addition, the price chart shows signs of a developing “flag” pattern.
Support and resistance levels
Resistance levels: 112.50, 150.00, 162.50.
Support levels: 75.00, 50.00, 25.00.
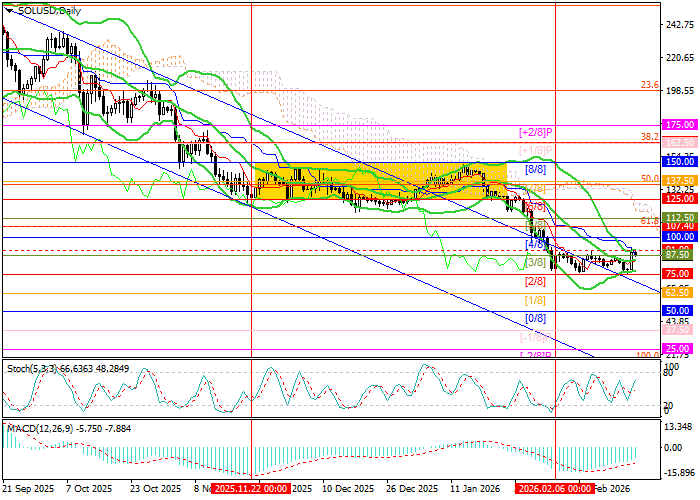
Trading scenarios and SOL/USD outlook
Short positions may be opened below the 75.00 level with targets at 50.00 and 25.00, and a stop-loss at 90.00. Time horizon: 5–7 days.
Long positions may be opened above 112.50 with targets at 150.00 and 162.50, and a stop-loss at 90.90.
Scenario
| Timeframe | Weekly |
| Recommendation | SELL STOP |
| Entry point | 72.90 |
| Take Profit | 50.00, 25.00 |
| Stop Loss | 90.00 |
| Key levels | 25.00, 50.00, 75.00, 112.50, 150.00, 162.50 |
Alternative scenario
| Recommendation | BUY STOP |
| Entry point | 114.60 |
| Take Profit | 150.00, 162.50 |
| Stop Loss | 90.90 |
| Key levels | 25.00, 50.00, 75.00, 112.50, 150.00, 162.50 |
