

Currently, the chart paints a tense picture. Below the price, a substantial liquidity pool has built up during the extended consolidation beneath the red resistance zone. This accumulation, driven by heavy trading activity and an increase in long positions, raises the risk of a liquidity sweep to the downside before any potential breakout higher.
On the positive side, the MACD continues to show strengthening bullish momentum, while the RSI on the daily chart remains comfortably above neutral, leaving room for further upside. Still, ENA’s next move is likely to depend heavily on Bitcoin: if BTC confirms its uptrend, it could act as a tailwind, increasing the probability of a sustainable breakout.
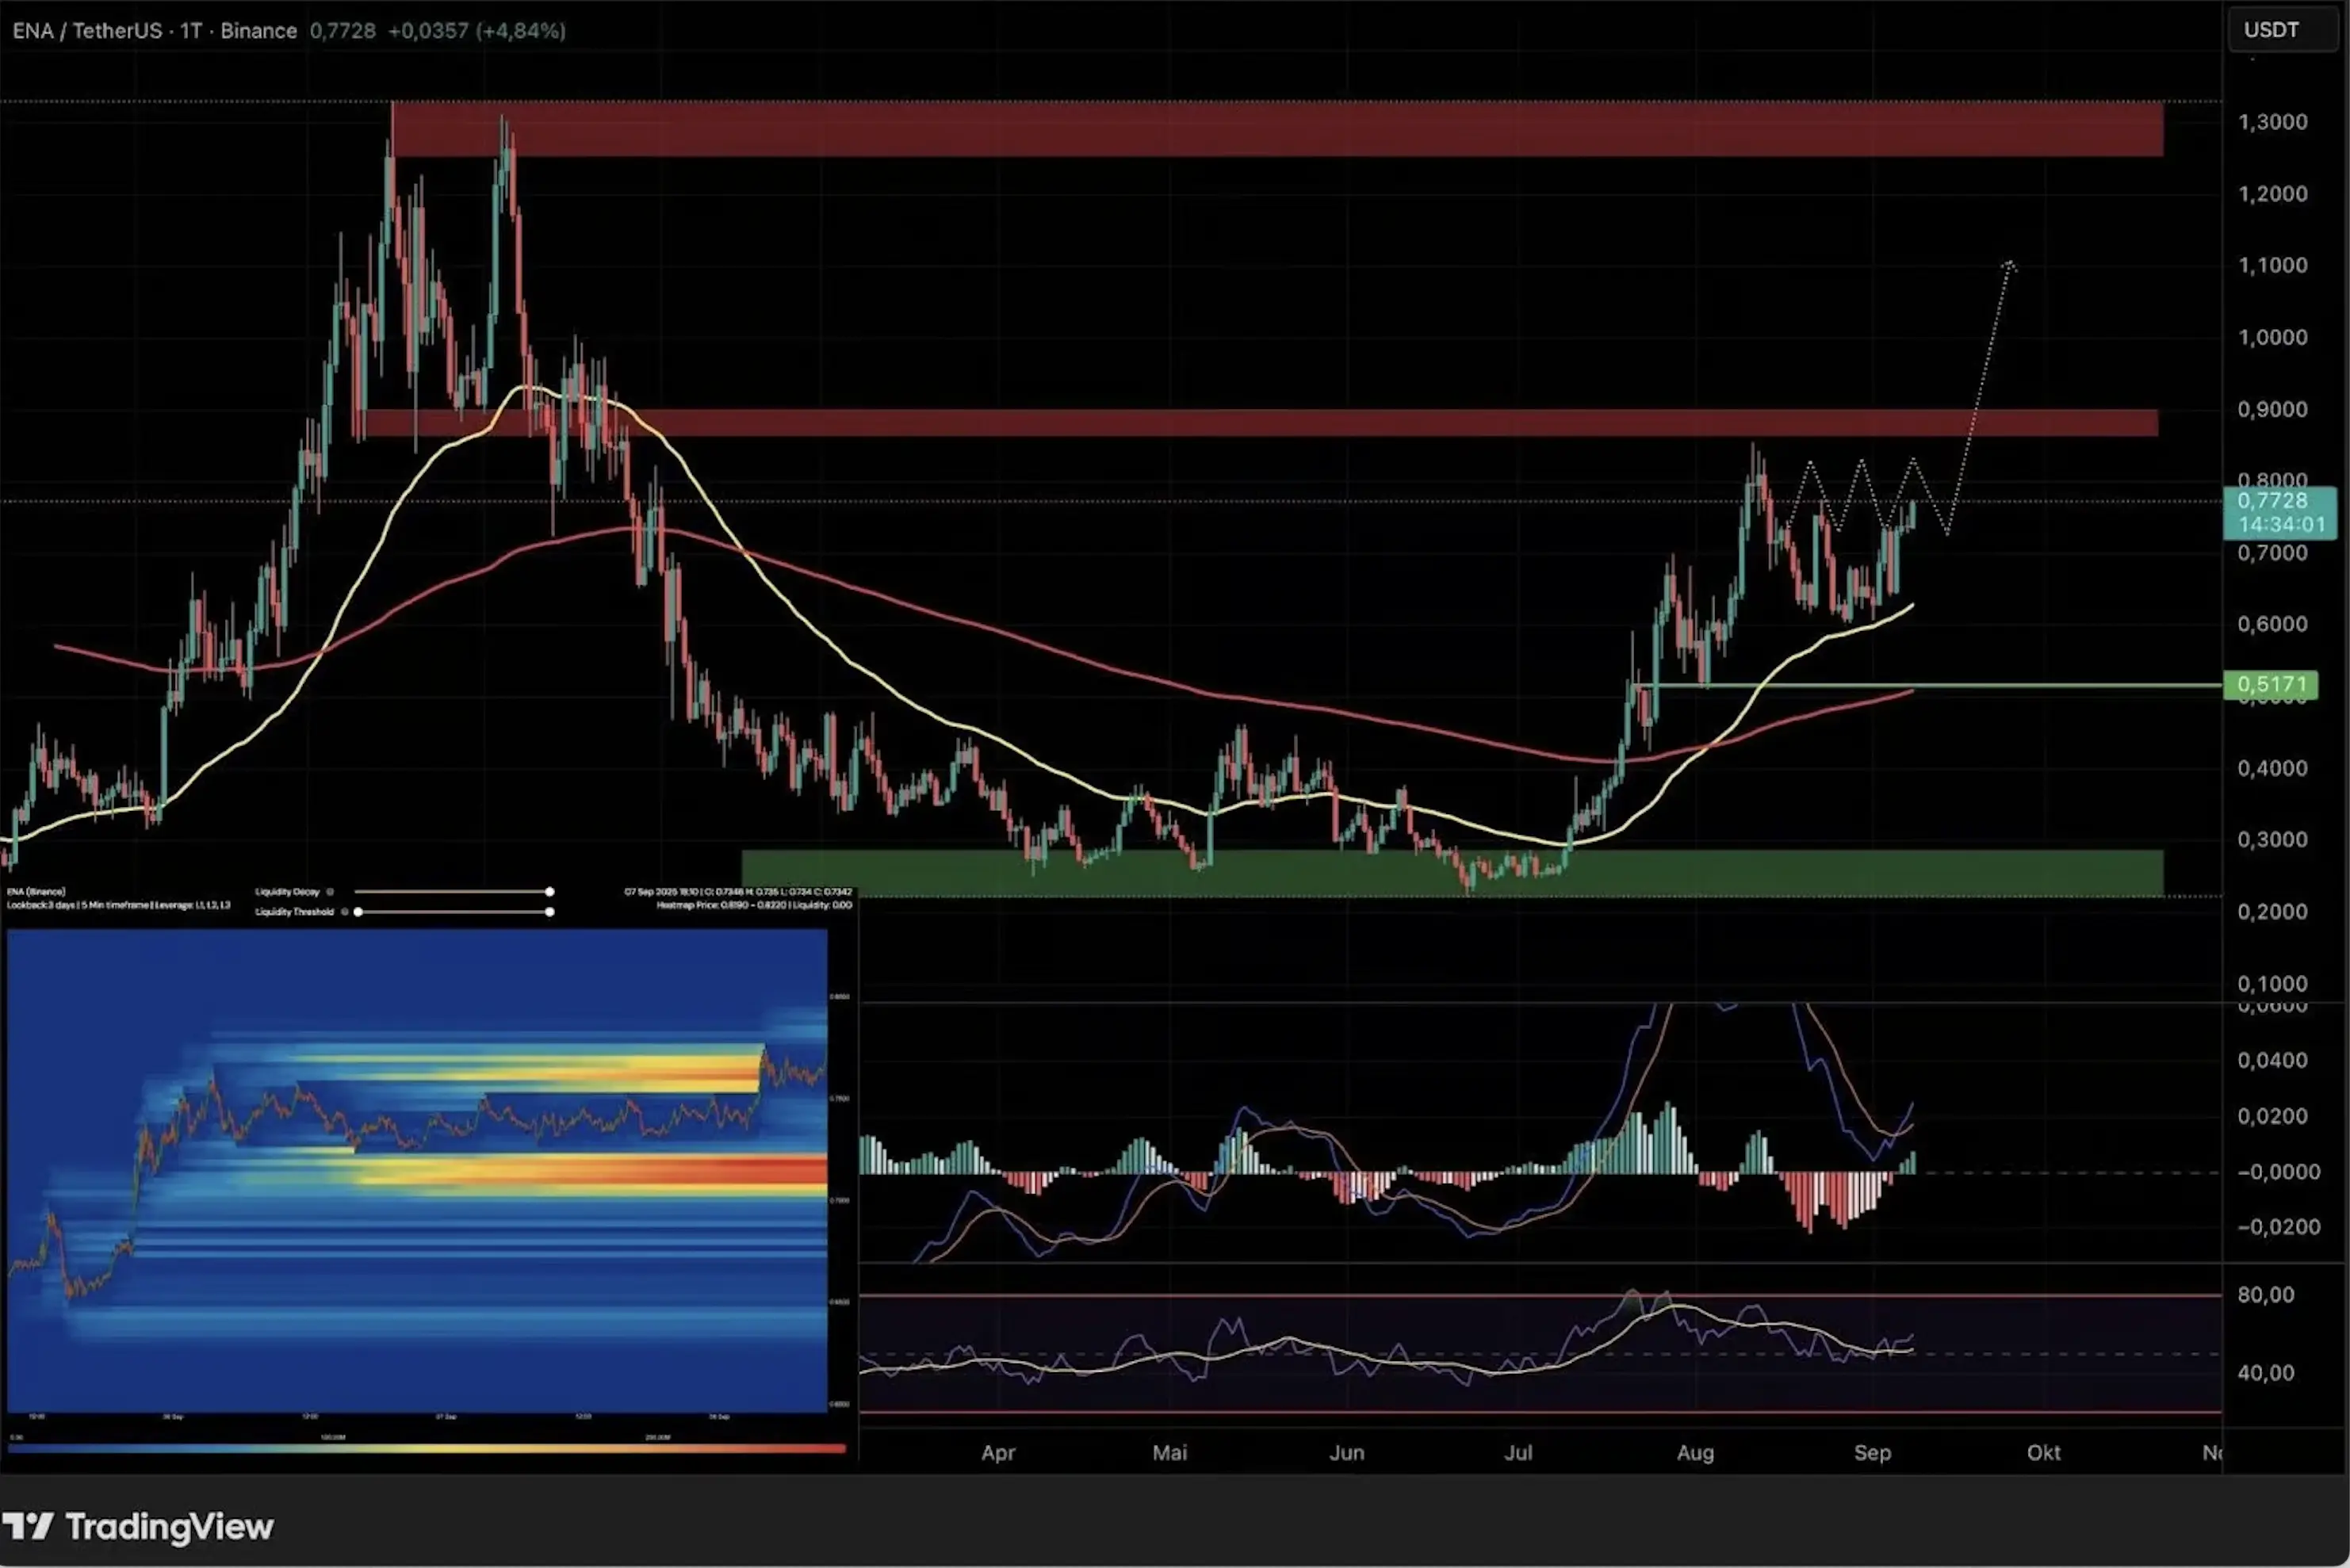
A heatmap highlights liquidity clusters below current price. Source: TradingView
4-Hour Chart: Consolidation Before the Next Move
In the 4-hour timeframe, ENA is consolidating just below resistance (yellow box). The white trendline provides crucial support; a break beneath it would weaken the structure and shift focus to the 50 EMA as the next support level.
Indicators point to short-term cooling. Both MACD and RSI suggest the market may need further consolidation, opening the door for a retest of the lower consolidation zone along the white trendline.
The liquidation heatmap reinforces this scenario: while most short positions have already been cleared, many new long positions have accumulated around the current price area. This makes it more likely that the market will dip to clear these longs before attempting a stronger breakout.