

The first pattern appeared on July 11. The lower trendline is at $108,000, while the upper one is around $124,900, corresponding to Bitcoin’s latest all-time high. A breakout above this level would open the way to a target of $144,200
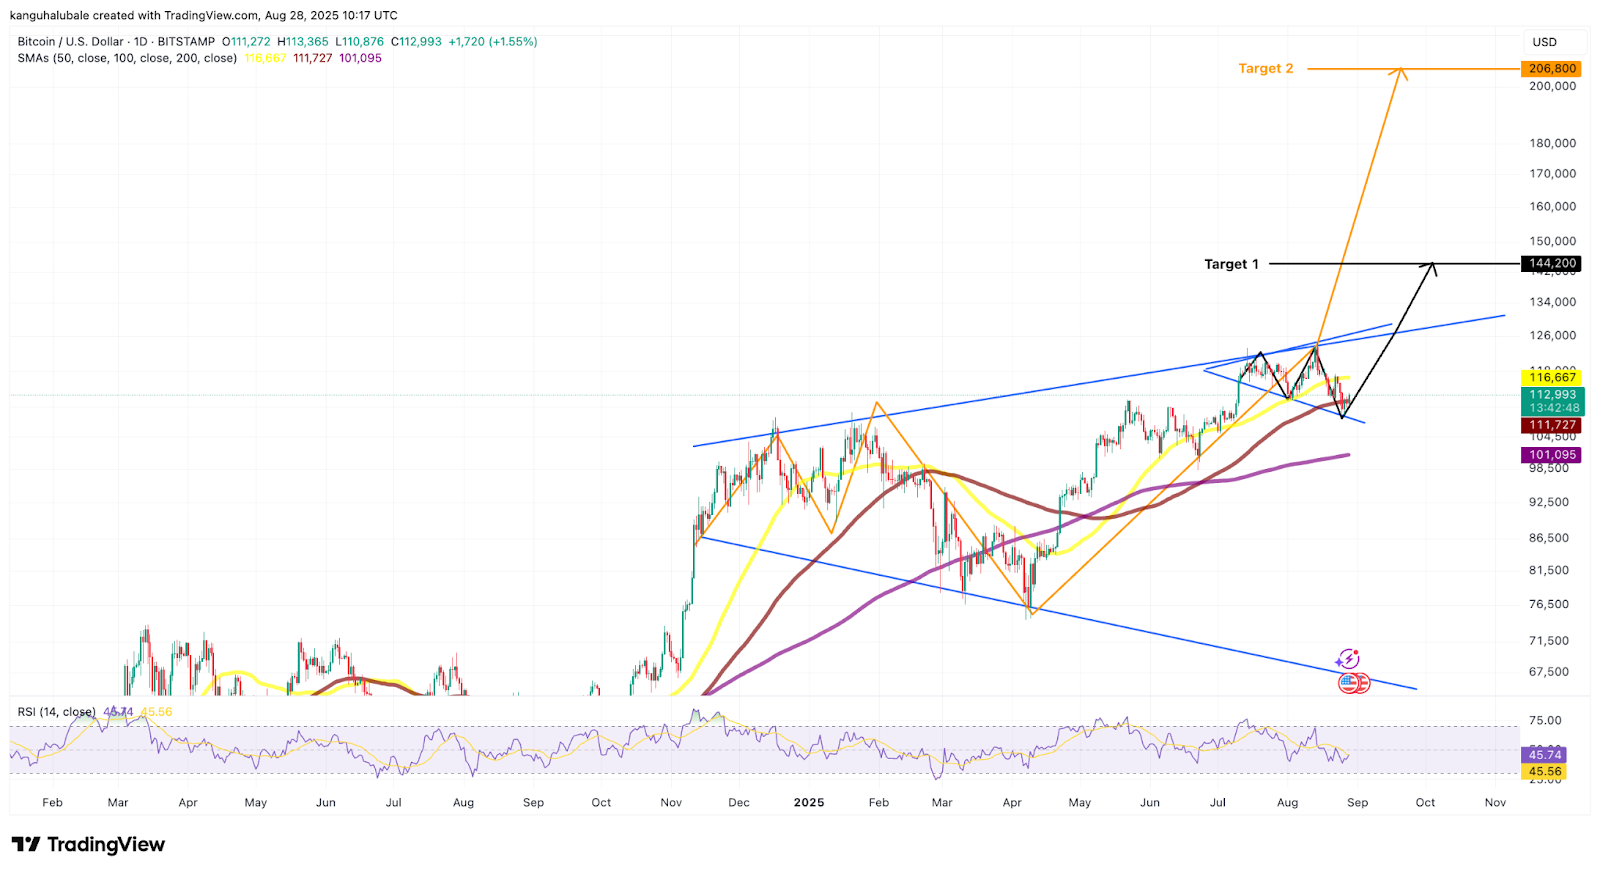
The second pattern has been forming over the past 280 days, noted analyst Galaxy. The nearest resistance is located near $125,000. Overcoming this level could trigger a rally toward $206,800.
$BTC
— Galaxy (@galaxyBTC) August 28, 2025
'Bullish Megaphone' pattern for the past 280 days. pic.twitter.com/owJy5l4JOt
Crypto influencer Faisal Baig highlighted a bullish megaphone pattern on the weekly timeframe with an even more ambitious target of $260,000. According to him, “the next stage of growth is inevitable.”
Bitcoin has broken out of this bullish megaphone pattern.
— Faisal Baig Binance Usdt Signals (@fbmskills) August 20, 2025
The next leg up is inevitable.
IN SHAA ALLAH pic.twitter.com/iEIpKROSvv
Potential Rebound
The latest correction in digital gold sparked panic among short-term holders — investors who have held the asset for less than 155 days. Many of them sold at a loss.
Analyst Frank emphasized that during Bitcoin’s pullback to $109,000, the MVRV indicator entered the oversold zone for the first time since April. At that time, the cryptocurrency fell to $74,000, followed by a 51% rally.
On the pullback to $109K, $BTC tapped the ‘Oversold’ zone on the short-term holder MVRV Bollinger Band. The last occurrence was at the $74K bottom in April; since then, BTC is up +51%. pic.twitter.com/cN2FXII4SS
— Frank (@FrankAFetter) August 27, 2025
The current MVRV reading suggests potential for an upward rebound, the expert noted.
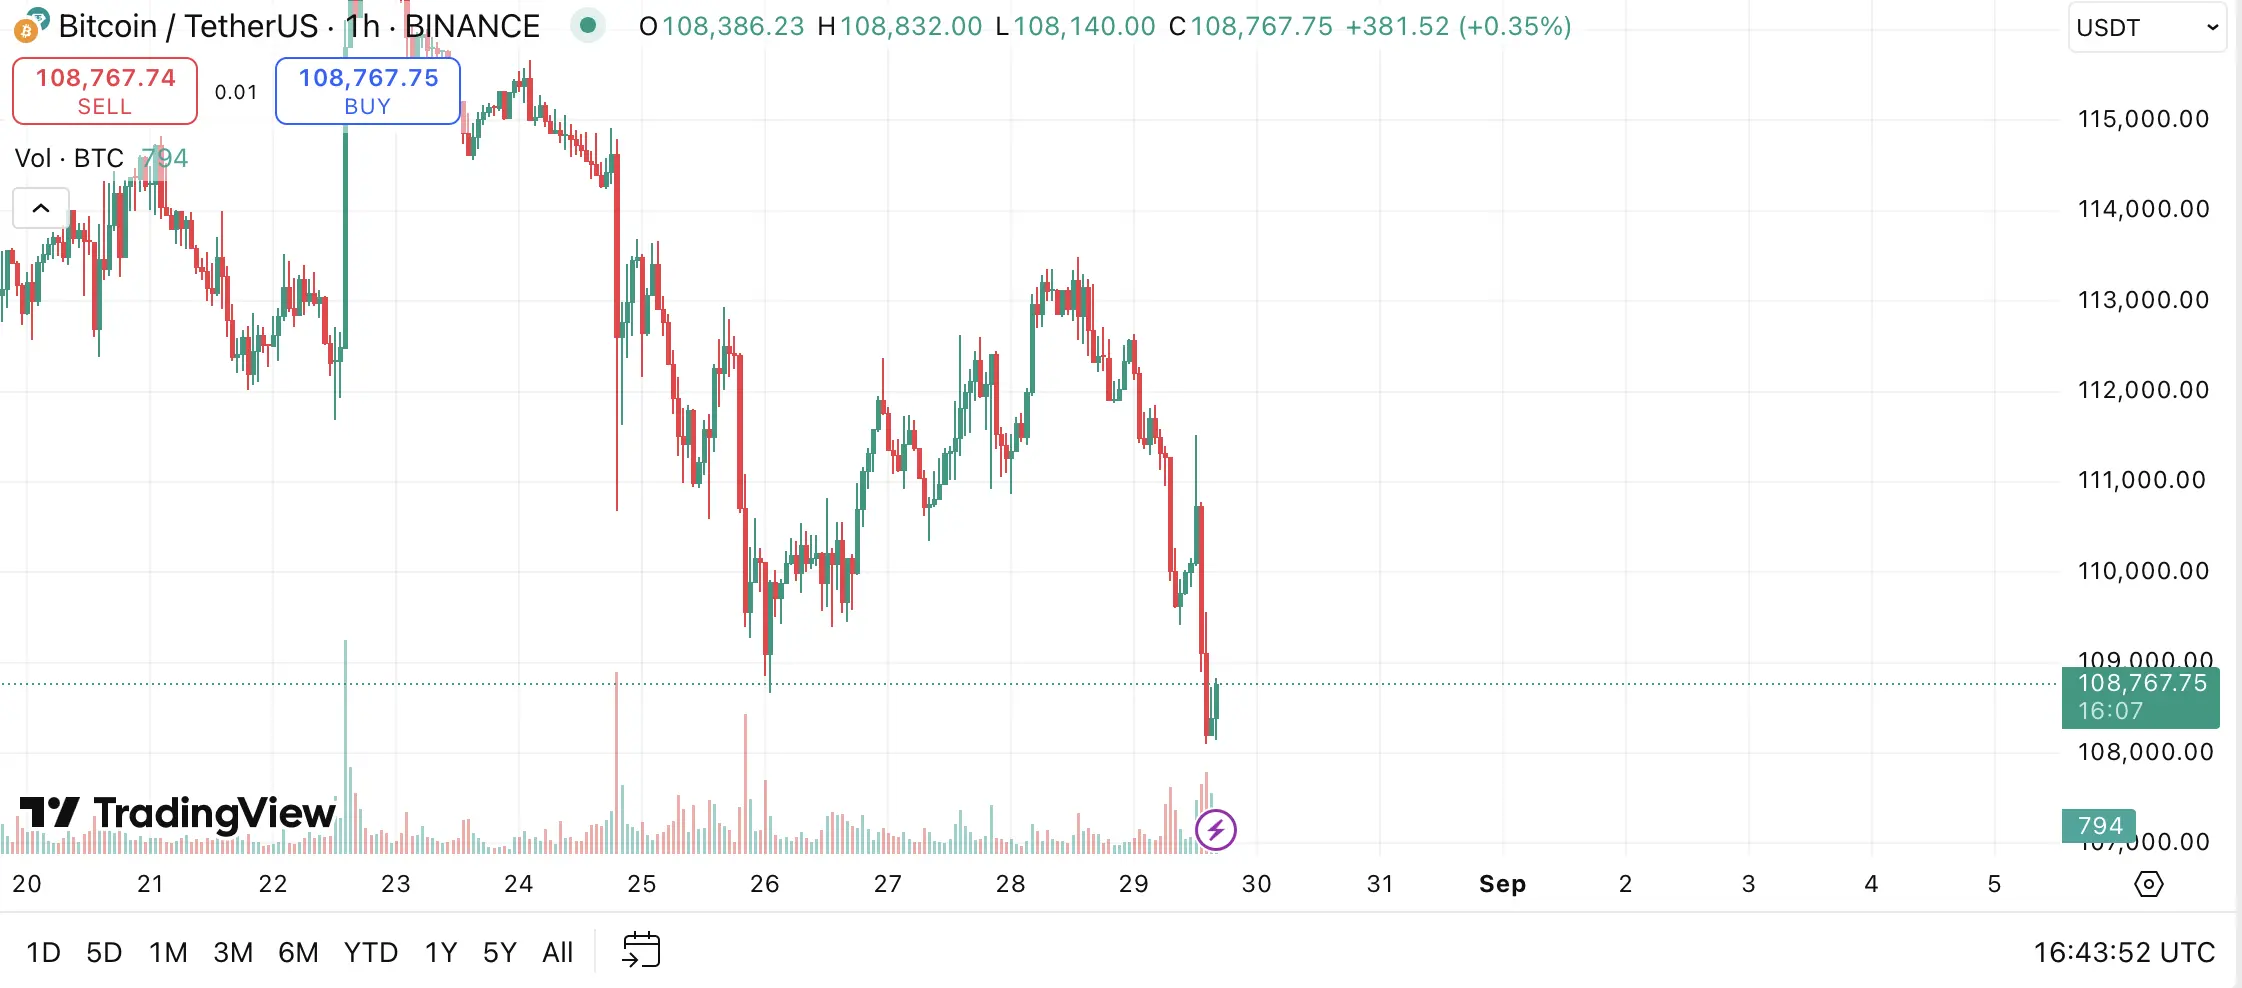
At the time of writing, Bitcoin is trading at $108,950, down 3.34% in the past 24 hours.
Earlier, FORECK.INFO reported on the topic “Bitcoin Weekly Close Above $114,000 Could Signal Rally Continuation.
