

According to the minutes of the latest meeting, most Fed officials are concerned that progress toward the 2.0% consumer price inflation target may be slower and more uneven than previously expected. Moreover, inflation is likely to remain above this level, and in such a scenario, policymakers for the first time in a long while did not rule out a return to a more “hawkish” rhetoric. These signals increased investor concerns about a prolonged period of high interest rates, although data released on Friday shifted the picture again. In December, the personal consumption expenditures (PCE) price index rose from 2.8% to 2.9% year-on-year, while the core indicator accelerated from 2.8% to 3.0%, exceeding forecasts of 2.9%. At the same time, US gross domestic product (GDP) growth in the fourth quarter slowed sharply from 4.4% to 1.4%, versus expectations of 2.8%. As a result, economic cooling is occurring alongside rising inflationary pressure, leaving the regulator facing a difficult choice over which problem to address first.
Meanwhile, on Friday the US Supreme Court ruled that a significant portion of the trade tariffs imposed by the current US administration was unlawful, as President Donald Trump did not have the authority to invoke the International Emergency Economic Powers Act (IEEPA) without congressional approval. Despite this, the president announced a new increase in global tariffs from 10.0% to 15.0%, this time under the Trade Act of 1974. These measures will be in effect for 150 days and cannot be extended without approval from lawmakers. In a 6–3 decision, the court ruled that the White House must seek congressional consent. The contradictory nature of the situation has reduced investor appetite for risk assets, while Trump himself claimed that the judiciary was influenced by foreign interests. According to estimates from the US Congressional Budget Office, the economic impact of the tariffs could amount to around $3.0 trillion over the next decade, as the Treasury has already collected more than $133.0 billion.
The decline in demand for digital assets is reflected in a fifth consecutive week of outflows from exchange-traded crypto funds, totaling $315.9 million over the past week and $3.8 billion overall. Analysts note that this trend confirms a reduction in exposure to risk assets within institutional portfolios amid rising geopolitical tensions and broad macroeconomic uncertainty. Overall market sentiment remains negative as well, with the Fear and Greed Index deep in the “extreme fear” zone at a reading of 5.
Support and resistance levels
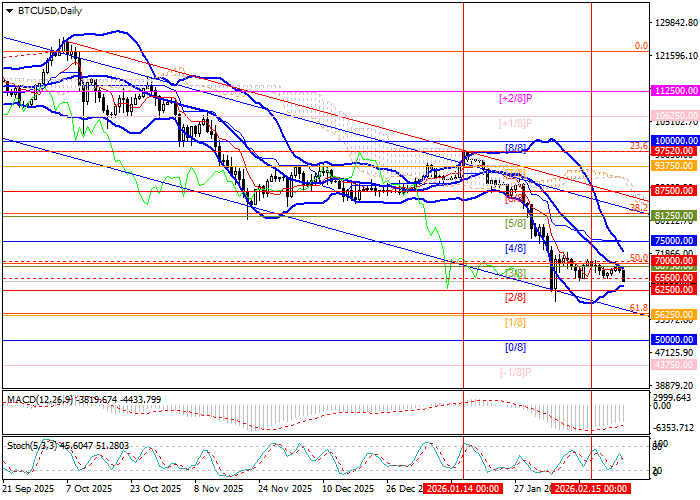
The instrument is trading within the 70,000.00–65,600.00 range. A break below 62,500.00 (Murray level [2/8]) would likely extend the decline toward 56,250.00 (Murray level [1/8], 61.8% Fibonacci retracement) and 50,000.00 (Murray level [0/8]). Conversely, a breakout above the upper Bollinger Band at 75,000.00 (Murray level [4/8]) would signal a resumption of growth toward 81,250.00 (Murray level [5/8], 38.2% Fibonacci retracement) and 93,750.00 (Murray level [7/8]).
Technical indicators maintain a sell signal: Bollinger Bands and the Stochastic oscillator are pointing lower, while the MACD histogram remains firmly in negative territory.
Resistance levels: 75,000.00, 81,250.00, 93,750.00.
Support levels: 62,500.00, 56,250.00, 50,000.00.
Trading scenarios and BTC/USD outlook
Short positions may be opened below 62,500.00 with targets at 56,250.00 and 50,000.00, and a stop-loss at 64,580.00. Time horizon: 5–7 days.
Long positions may be opened above 75,000.00 with targets at 81,250.00 and 93,750.00, and a stop-loss at 71,500.00.
