

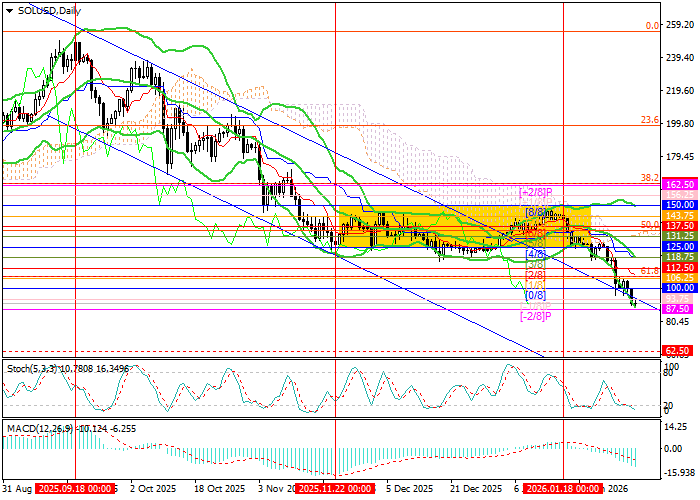
At present, the outlook for a further decline remains intact, as confirmed by technical indicators: Bollinger Bands are pointing lower, the MACD histogram is expanding in negative territory, and the Stochastic oscillator has returned to the oversold zone. If the price consolidates below 87.50 (Murray level [–2/8]), the instrument is likely to test the 62.50 target (Murray level [2/8], W1). The key level for bulls is seen at 125.00 (Murray level [4/8]), reinforced by the middle Bollinger Band. A breakout above this area would create conditions for a trend reversal and act as a catalyst for growth toward 150.00 (Murray level [8/8], upper Bollinger Band) and 162.50 (Murray level [+2/8], upper Bollinger Band); however, this scenario appears less likely in the near term.
It is also worth noting that on the weekly chart, Bollinger Bands remain tilted downward, while a “flag” pattern has formed, confirming the strength of the prevailing bullish trend.
Support and Resistance Levels
Resistance levels: 125.00, 150.00, 162.50.
Support levels: 87.50, 62.50.
Trading Scenarios and SOL/USD Forecast
Short positions can be opened below 87.50 with a target at 62.50 and a stop-loss at 100.00. Time horizon: 5–7 days.
Long positions can be opened above 125.00 with targets at 150.00 and 162.50 and a stop-loss at 110.00.
Scenario
| Timeframe | Weekly |
| Recommendation | SELL STOP |
| Entry point | 86.90 |
| Take Profit | 62.50 |
| Stop Loss | 100.00 |
| Key levels | 62.50, 87.50, 125.00, 150.00, 162.50 |
Alternative scenario
| Recommendation | BUY STOP |
| Entry point | 127.00 |
| Take Profit | 150.00, 162.50 |
| Stop Loss | 110.00 |
| Key levels | 62.50, 87.50, 125.00, 150.00, 162.50 |
