

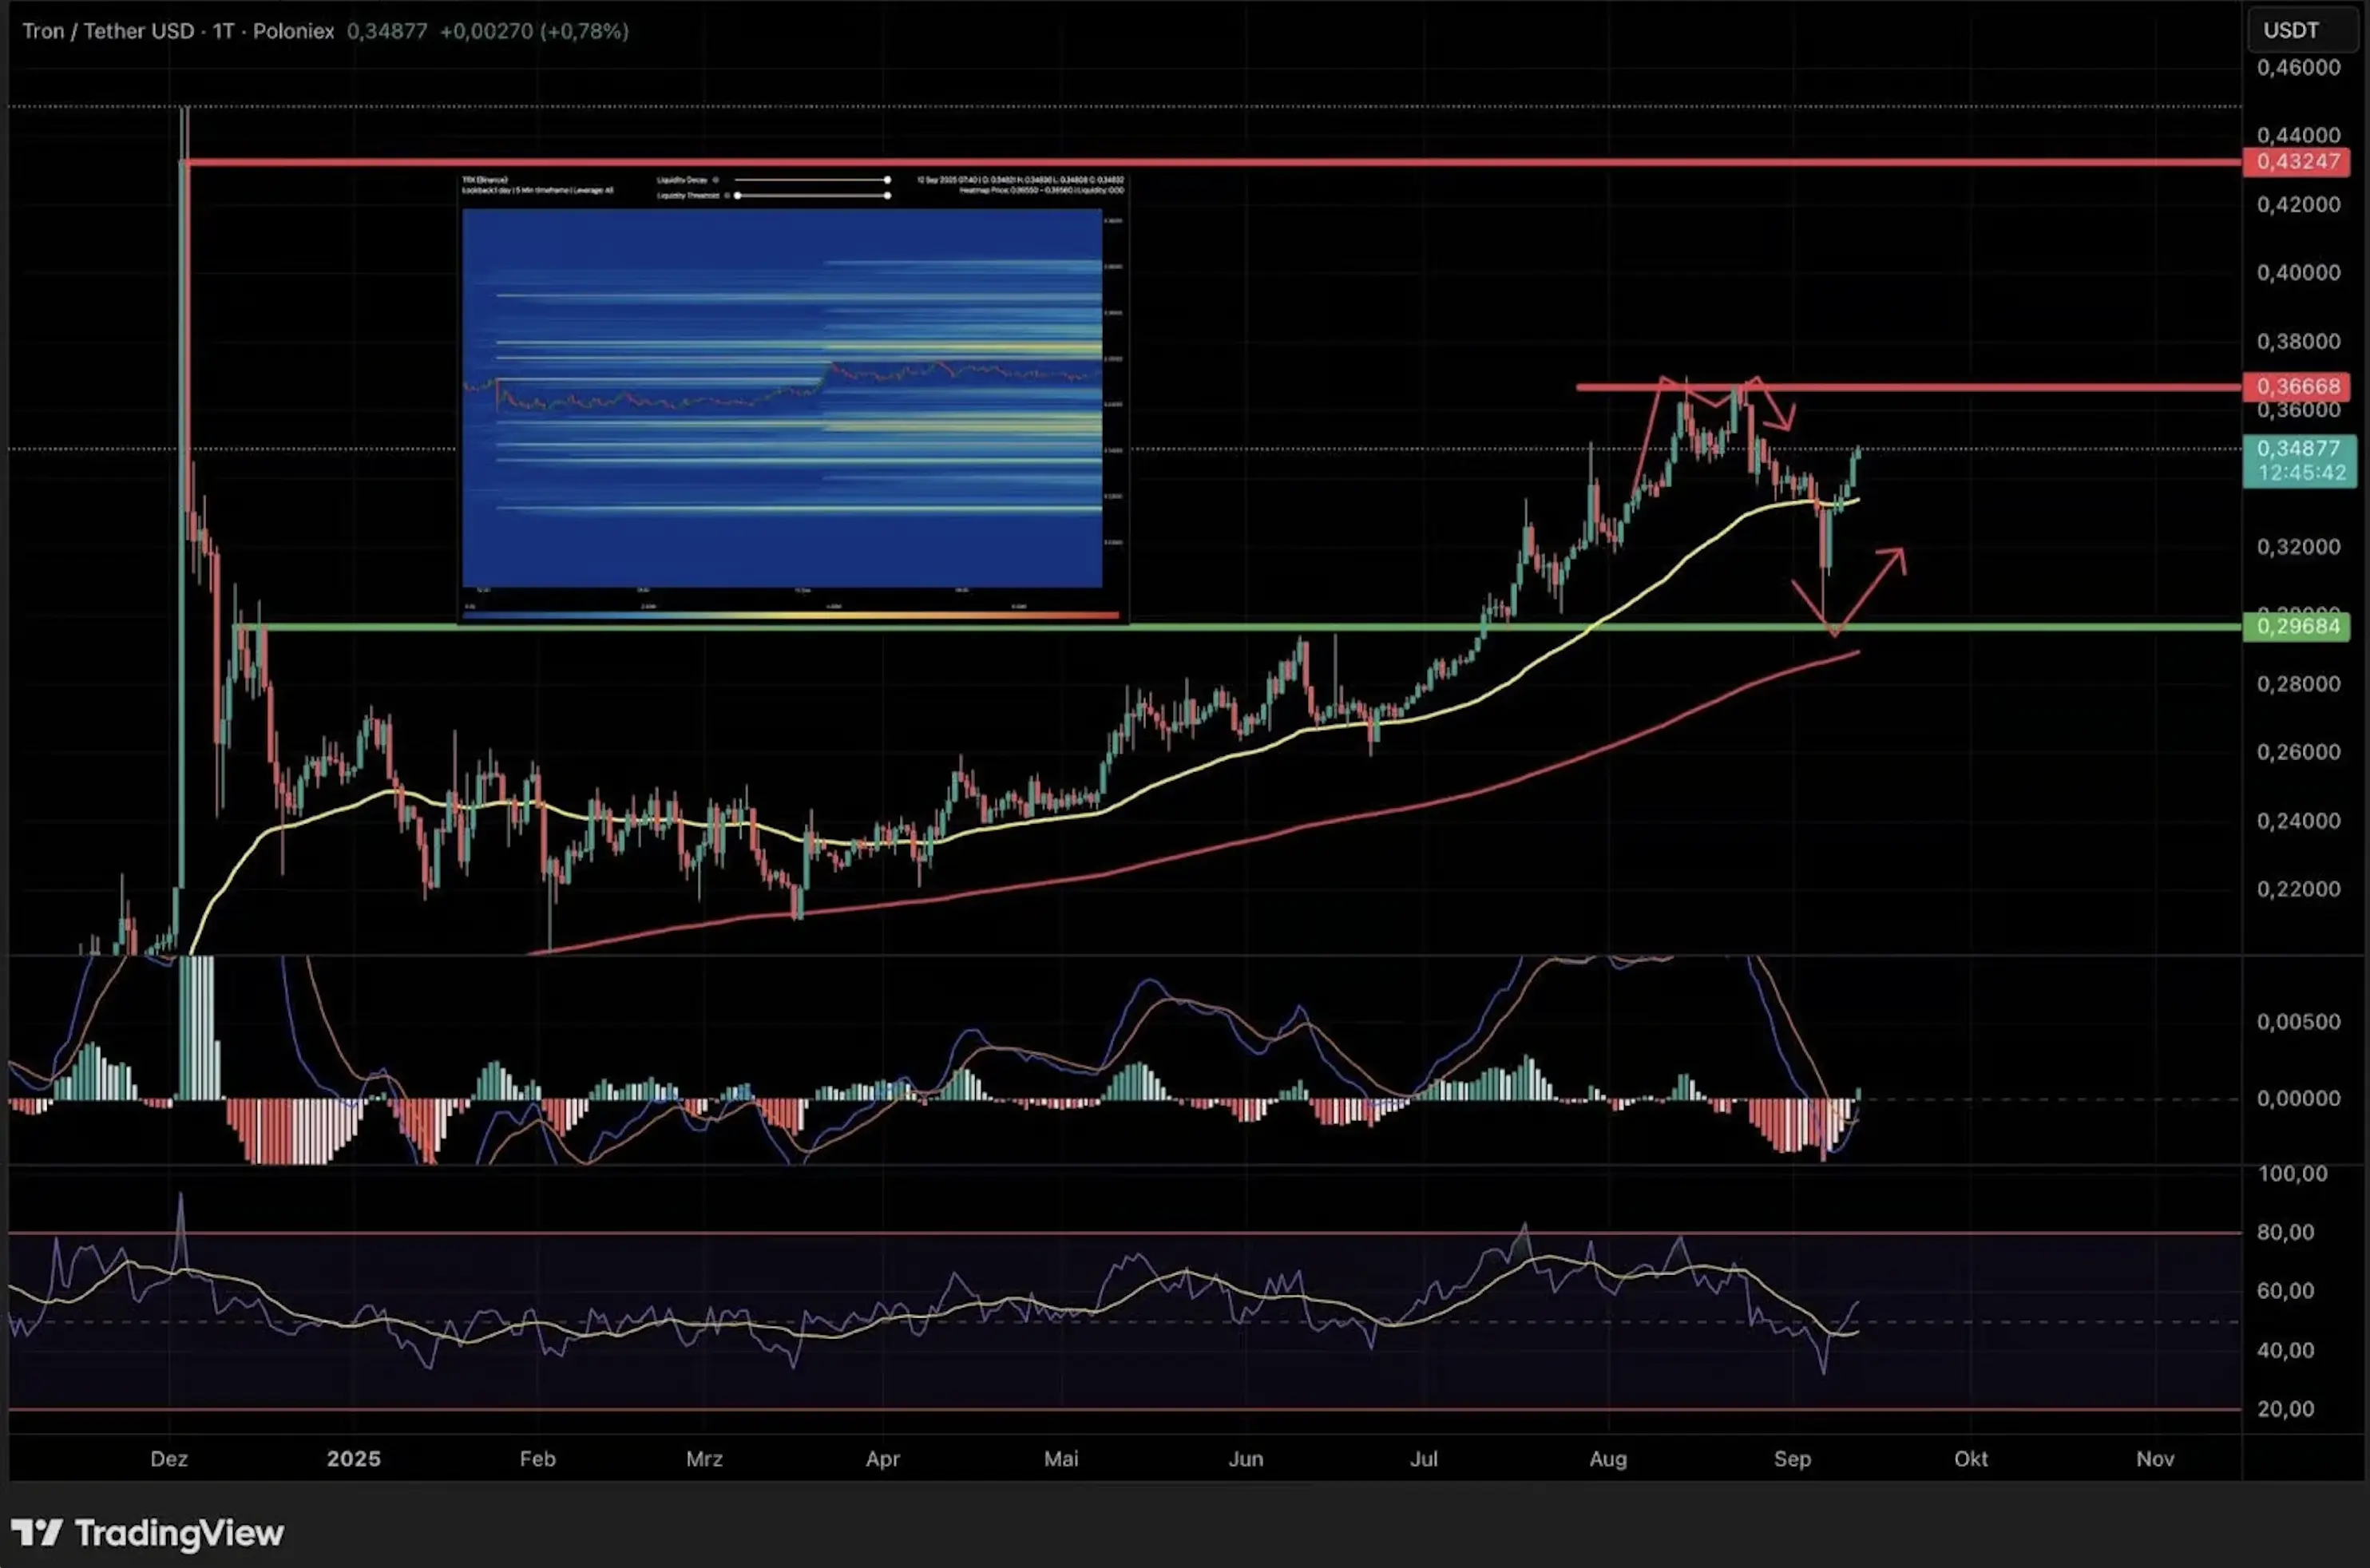
At the start of 2025, TRX managed to hold above the 200 EMA and in early April broke past the 50 EMA, setting off a strong upward move. However, resistance near $0.36 triggered the formation of an M-pattern — a bearish signal that pushed the token into a correction. TRX not only lost the resistance but also slipped back below the 50 EMA, eventually testing the $0.29 area where the 200 EMA aligns with a broader green support zone.
This decline came with a few positives. The MACD (Moving Average Convergence Divergence) and RSI (Relative Strength Index), both previously overheated, have cooled off. The MACD is now showing fading bearish momentum and hints at a potential return to positive territory, while the RSI has moved back above the 50 level and crossed its moving average upward — a constructive sign.
What’s more, demand at the $0.29 support was strong: TRX was quickly bought up, allowing the token to close back above the 50 EMA. This reaction underlines steady buying interest and increases the chances of the medium-term uptrend resuming, provided the $0.29 zone holds firm.
A candlestick chart of TON/USDT shows a similar setup: resistance tested at $0.33, with moving averages, MACD, RSI and a heatmap overlay pointing to key support around $0.28 and resistance near $0.34.
4-Hour Chart: Key Support in Focus
The 4-hour chart mirrors the daily structure. Price could retest the green support zone where both the 50 EMA and 200 EMA converge, making it a decisive level that will likely determine TRX’s short-term direction.
Currently, the MACD signals waning bullish momentum, while the RSI is deep in overbought territory. Together, these suggest a potential short-term pullback.
Liquidation levels reinforce this risk. In the current range, long positions dominate, with many high-leverage longs clustered below support. If TRX fails to hold the EMAs and the green zone, a drop toward the next major area at $0.31 becomes likely.
The outcome is clear: holding support would preserve stability and confirm the bullish structure, while a break lower could trigger an accelerated downturn and shift focus to deeper price regions.
