

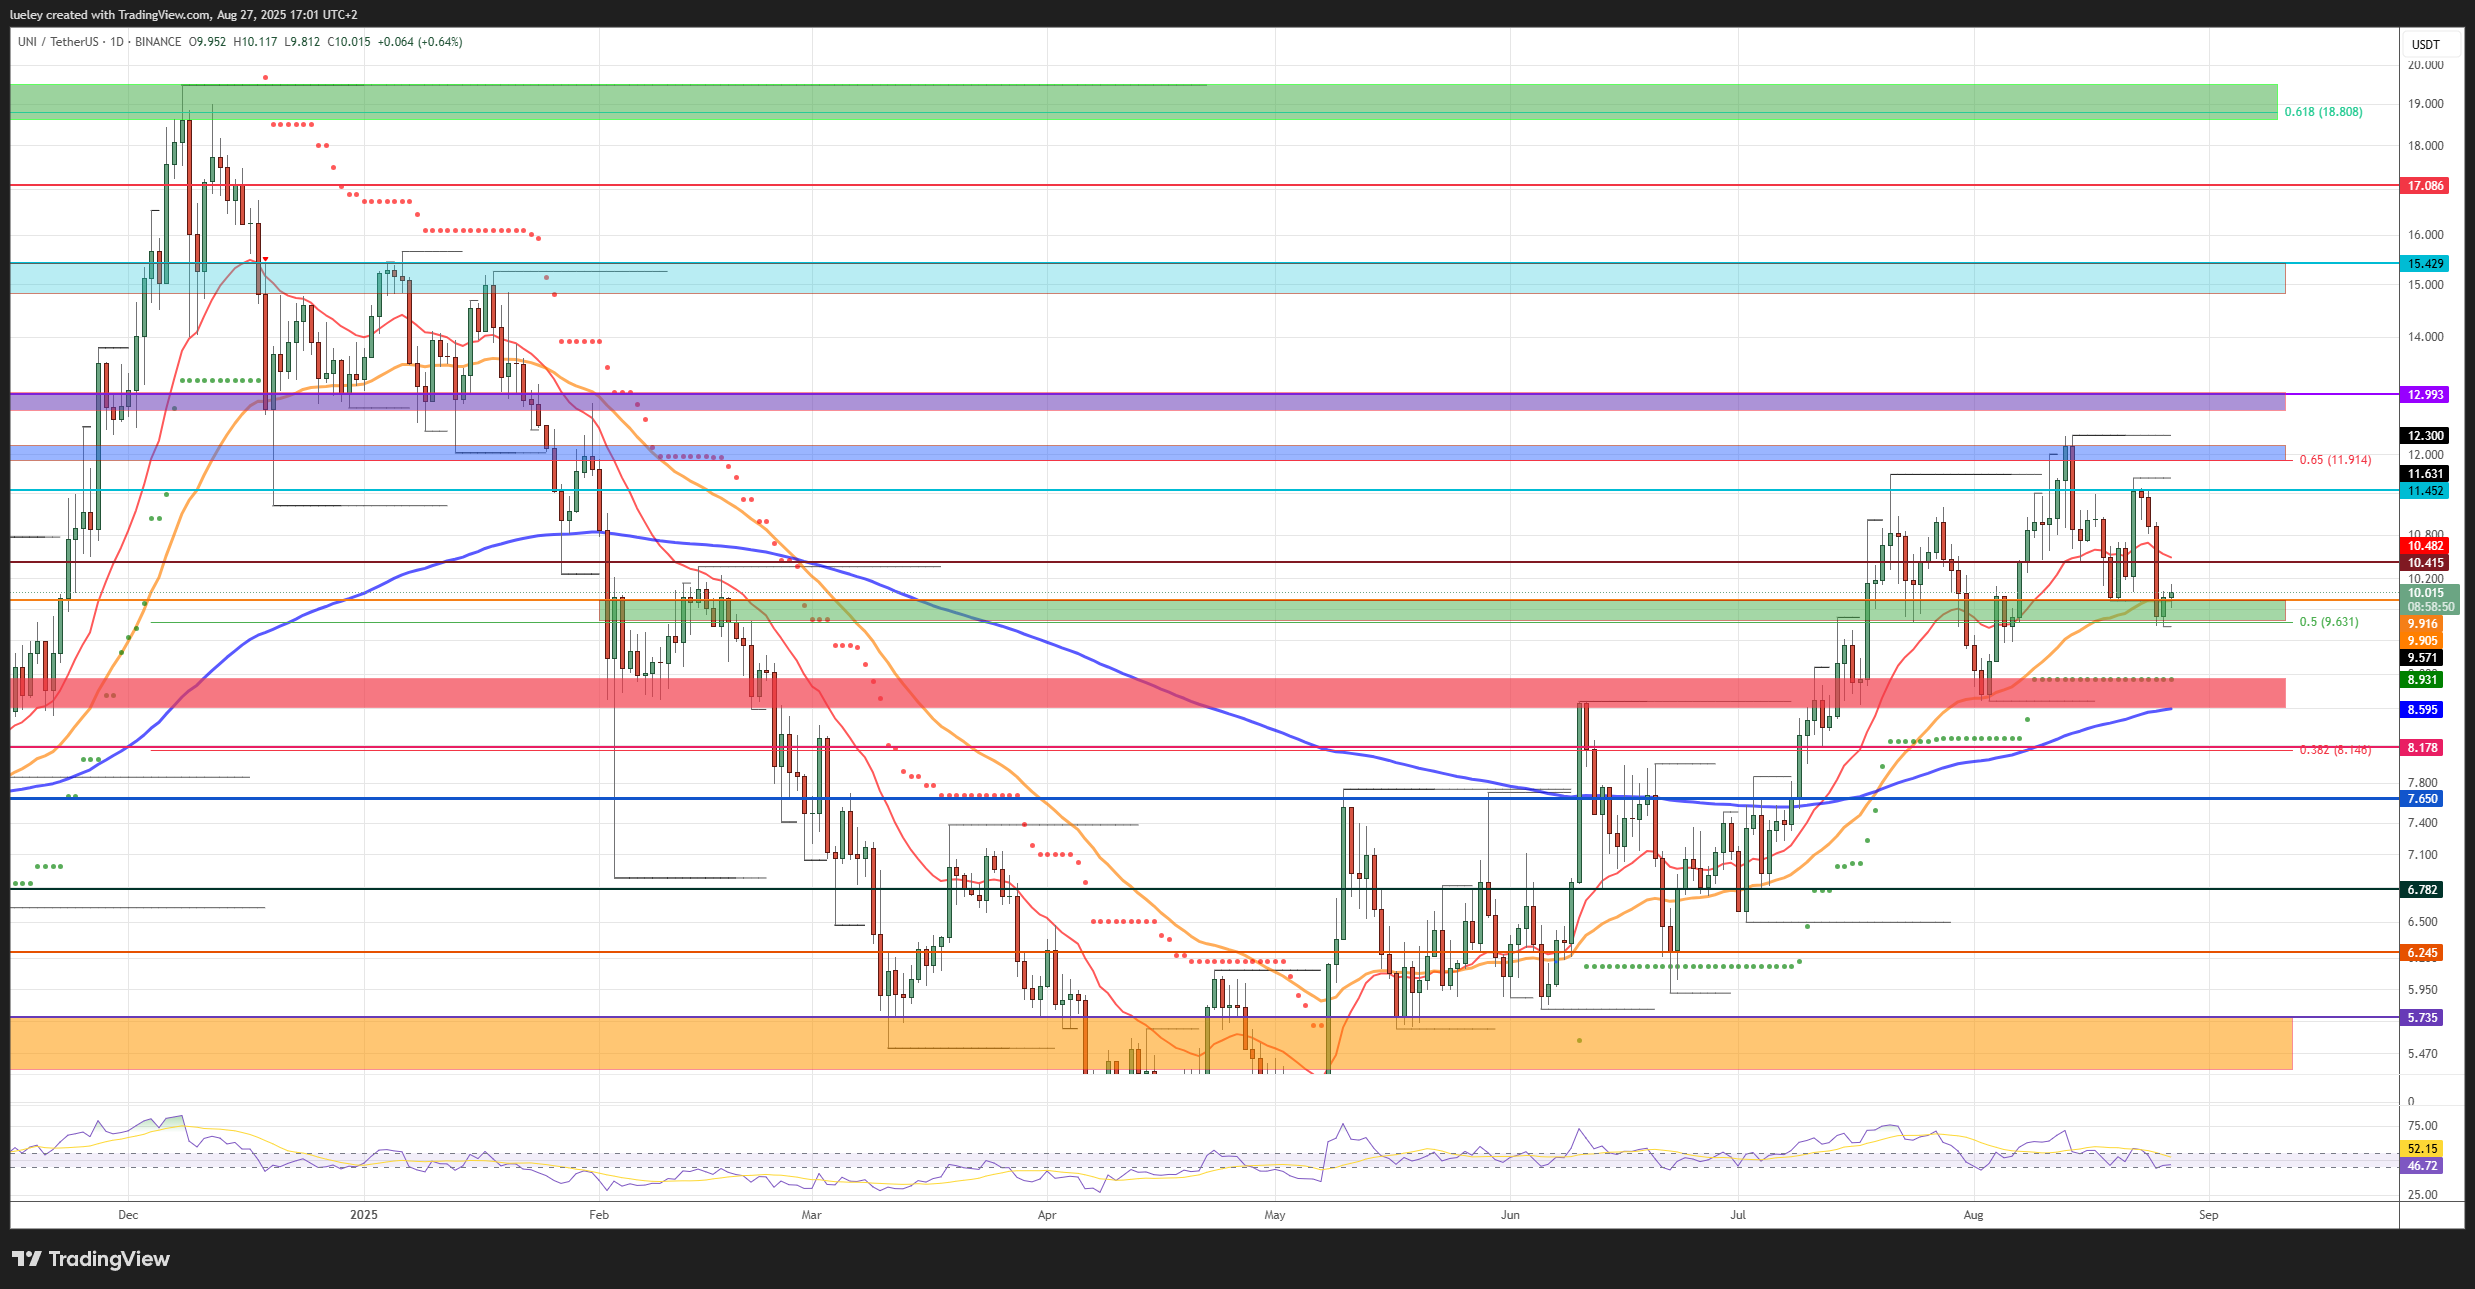
The price of the largest decentralized crypto exchange in the Ethereum ecosystem, Uniswap (UNI), has recovered significantly from its prior lows in recent months and briefly pushed to a new swing high at $12.30. Although UNI was recently rejected to the downside in the golden pocket area, it now appears to be stabilizing at the 50-day moving average above $9.90. The following levels should be monitored in the coming weeks.
Although Uniswap has given back some ground over the last 30 trading days, at $10.02 it still trades 15% above the confluence support of the monthly low and the 200-day moving average (EMA200, blue). One reason for the relative strength is Ethereum’s (ETH) bullish performance. Early this week, a previously unknown whale moved $2.5 billion worth of ETH acquired earlier into staking.
To continue the advance of recent months, bulls first need to hold UNI around the 50% Fibonacci retracement and the EMA50 (orange). If that succeeds, another push toward the 20-day moving average (EMA20, red) at $10.41 comes into view. If yesterday’s low at $9.61 is sustainably undercut, a pullback toward the red support zone between $8.94 and $8.61 has to be considered.
Bullish price targets for the coming months
Bullish targets: $10.41, $11.45, $11.91/$12.14, $12.70/$12.99, $14.82/$15.43, $17.08, $18.62/$19.49
After a 20% correction, bulls are currently trying to stabilize the price in the green zone. If Uniswap can move higher from this support, the EMA20 at $10.41 comes back into focus. Reclaiming this moving average would open further upside toward last week’s high at $11.45, putting price back within striking distance of the monthly high. If the recovery continues, a key decision is likely in the golden pocket between $11.91 and $12.14. A sustained breakout above this strong resistance would clear the way to the next resistance area around the January 2025 breakdown zone between $12.70 and $12.99, where sellers are likely to defend.
Only if bulls can break out sustainably above the purple resistance zone will the chart picture brighten further, allowing Uniswap to aim for the turquoise area around the yearly high between $14.82 and $15.43. Price failed there several times in January. Whether buyers can muster enough momentum will also depend on Ethereum’s performance in the coming weeks. If the crypto sector extends its recent recovery, the chances of pushing to new yearly highs improve.
Uniswap could then extend dynamically above $15.43 toward the next technical hurdle at $17.08. This resistance acted as an insurmountable barrier in March 2024 and could not be broken sustainably in December 2024 either. If UNI does not quickly reject lower here and can stabilize above the turquoise area despite profit-taking, a medium-term trend continuation toward the green resistance zone around last year’s high becomes plausible. The golden pocket of the larger move also runs in this region. The area between $18.62 and $19.49 represents the maximum upside target for the coming months.
Bearish price targets for the coming months
Bearish targets: $9.91/$9.63, $8.94/$8.61, $8.17, $7.65, $6.78, $6.24, $5.73/$5.36
Bears attempted to start a counter-move in recent weeks. At the support around the EMA50, however, buyers stepped in and prevented a larger correction. As long as Uniswap remains capped below the EMA20, a retest of the monthly low cannot be ruled out. A dynamic drop below yesterday’s low risks extending the downswing toward the multiple red support area formed by the supertrend, monthly low, and EMA200. The zone between $8.94 and $8.61 is the pivotal area on the downside. If a sustained reversal fails and Uniswap closes back below the 200-day moving average, the chart would deteriorate notably.
Price could then quickly fall back to the 38% Fibonacci retracement at $8.15. A retest of the July 9 breakout level at $7.65 is also conceivable. If buyers remain absent there and cannot stabilize UNI, the probability of a drop to at least $6.78 increases. Bulls would likely make every effort to stabilize price at the latest there. If UNI unexpectedly slips below that support as well, the downtrend could accelerate toward the horizontal support at $6.24. That would bring the maximum bearish target zone between $5.73 and $5.36 within reach. This area represented the maximum downside target into the end of September.
A look at the indicators
The recent correction has pushed the daily RSI back to the lower edge of the neutral band. It must stabilize here to avoid a fresh sell signal. On the weekly chart, the RSI also risks slipping into neutral, which would negate its prior buy signal. For now, at 56 it still sits slightly above its 14-week average, leaving a residual chance to resume the uptrend that has been in place since April.
