

The cryptocurrency market remains under pressure amid geopolitical tensions in the Persian Gulf region. Following the blockade of the Strait of Hormuz, Brent crude oil prices surged to around $114 per barrel and continue to hold above $100. This development increases the likelihood of accelerating global inflation, prompting investors to move away from BTC in favor of traditional safe-haven assets, particularly precious metals. Analysts note that digital currencies are still widely perceived as risk assets, closer to equities than to reliable stores of value.
Additional concerns arise from signs of simultaneous acceleration in consumer prices and weakening labor market conditions. Consumer inflation reached 2.4% in January, while producer prices rose to 2.9%. Meanwhile, the unemployment rate increased to 4.4% in February, and non-farm payrolls declined by 92,000. This combination raises uncertainty about the future course of Federal Reserve policy, as officials may have to balance inflation risks with slowing employment growth. Further increases in energy prices could complicate the situation, potentially triggering a sharp correction in global equity markets and subsequently in cryptocurrencies. Analysts currently estimate this risk at around 35%, compared with 20% at the beginning of last week.
At the same time, U.S. President Donald Trump described the surge in oil prices as a small price to pay for global security and called it temporary. However, this statement failed to reassure traders. The balance of digital exchange-traded funds, which had begun to recover earlier in the week, returned to decline by the end of it. Net inflows into Bitcoin ETFs totaled only $148.5 million over five sessions. Meanwhile, the Crypto Fear & Greed Index remains in the “extreme fear” zone, falling to just 8 points, close to historical lows.
Overall, fundamental factors continue to support the persistence of a downward trend in the BTC/USD pair.
Support and resistance levels
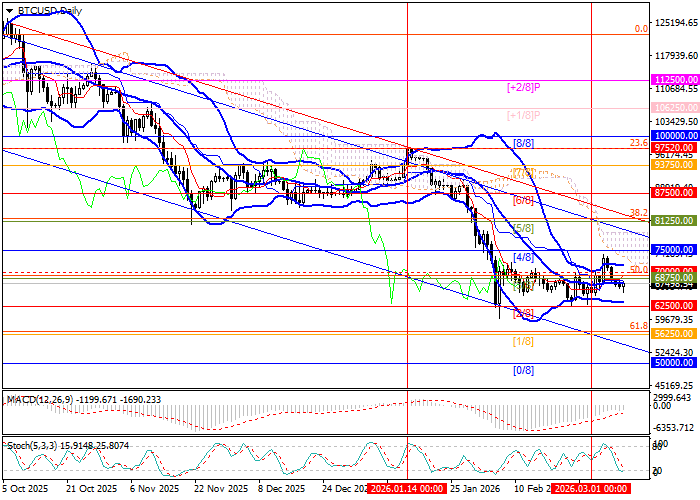
The price remains within the medium-term sideways range of 70,000.00–62,500.00, and a significant move is likely only after a breakout. A consolidation above 70,000.00 (50.0% Fibonacci retracement) could trigger a rally toward 75,000.00 (Murray level [4/8]), 81,250.00 (Murray level [5/8], 38.2% Fibonacci retracement), and 87,500.00 (Murray level [6/8]). Conversely, a breakout below 62,500.00 (Murray level [2/8]) could open the path toward 56,250.00 (Murray level [1/8], 61.8% Fibonacci retracement) and 50,000.00 (Murray level [0/8]).
Technical indicators provide mixed signals. Bollinger Bands remain flat, the MACD histogram is stable in negative territory, while the Stochastic oscillator has entered the oversold zone, leaving room for a potential rebound. On the weekly chart, Bollinger Bands continue to decline, and the formation of a flag pattern suggests that the broader bearish trend may still dominate the market.
Resistance levels: 70,000.00, 75,000.00, 81,250.00, 87,500.00.
Support levels: 62,500.00, 56,250.00, 50,000.00.
Trading scenarios and BTC/USD forecast
Short positions can be opened below 62,500.00 with targets at 56,250.00 and 50,000.00, with a stop-loss at 67,000.00. Implementation period: 5–7 days.
Long positions can be opened above 70,000.00 with targets at 75,000.00, 81,250.00, and 87,500.00, with a stop-loss at 66,000.00.
