

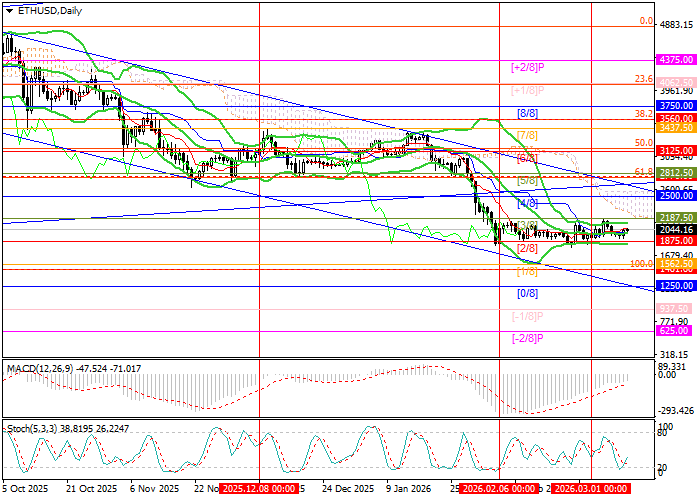
Technical indicators do not provide a unified signal, confirming the ongoing uncertainty in the market. Bollinger Bands remain flat, the MACD histogram stays stable in negative territory, and the Stochastic oscillator is turning upward from the oversold zone, suggesting a possible corrective rebound, although its potential appears limited. At the same time, prices remain within a long-term descending channel, and Bollinger Bands on the weekly chart are directed downward, confirming the continuation of the broader bearish trend. Under these conditions, the current sideways movement may represent the formation of a “flag” pattern.
Support and resistance levels
Resistance levels: 2187.50, 2500.00, 2812.50, 3125.00.
Support levels: 1875.00, 1481.50, 1250.00.
Trading scenarios and ETH/USD forecast
Short positions may be opened below the level of 1875.00 with targets at 1481.50 and 1250.00 and a stop-loss at 2090.00. Implementation period: 5–7 days.
Long positions may be opened above 2187.50 with targets at 2500.00, 2812.50, and 3125.00 with a stop-loss at 1930.00.
Scenario
| Timeframe | Weekly |
| Recommendation | SELL STOP |
| Entry Point | 1846.00 |
| Take Profit | 1481.50, 1250.00 |
| Stop Loss | 2090.00 |
| Key Levels | 1250.00, 1481.50, 1875.00, 2187.50, 2500.00, 2812.50, 3125.00 |
Alternative scenario
| Recommendation | BUY STOP |
| Entry Point | 2215.00 |
| Take Profit | 2500.00, 2812.50, 3125.00 |
| Stop Loss | 1930.00 |
| Key Levels | 1250.00, 1481.50, 1875.00, 2187.50, 2500.00, 2812.50, 3125.00 |
