

Analysts at JPMorgan Chase & Co. believe the decision reflects a cautious stance toward companies relying heavily on crypto reserves. They warn that other index providers, including MSCI and Russell, may follow suit. Bloomberg’s Eric Balchunas points to the high volatility of Strategy’s stock and its extreme dependence on Bitcoin as key reasons. According to JPMorgan estimates, inclusion could have attracted inflows equivalent to roughly 250,000 BTC, making the market even more sensitive to passive capital allocations.
For now, U.S. monetary policy remains the key driver of BTC/USD. On Wednesday at 20:00 (GMT+2), the Federal Reserve will announce the results of its meeting: according to the CME Group FedWatch Tool, there is currently a 96.2% probability of a 25 bps rate cut.
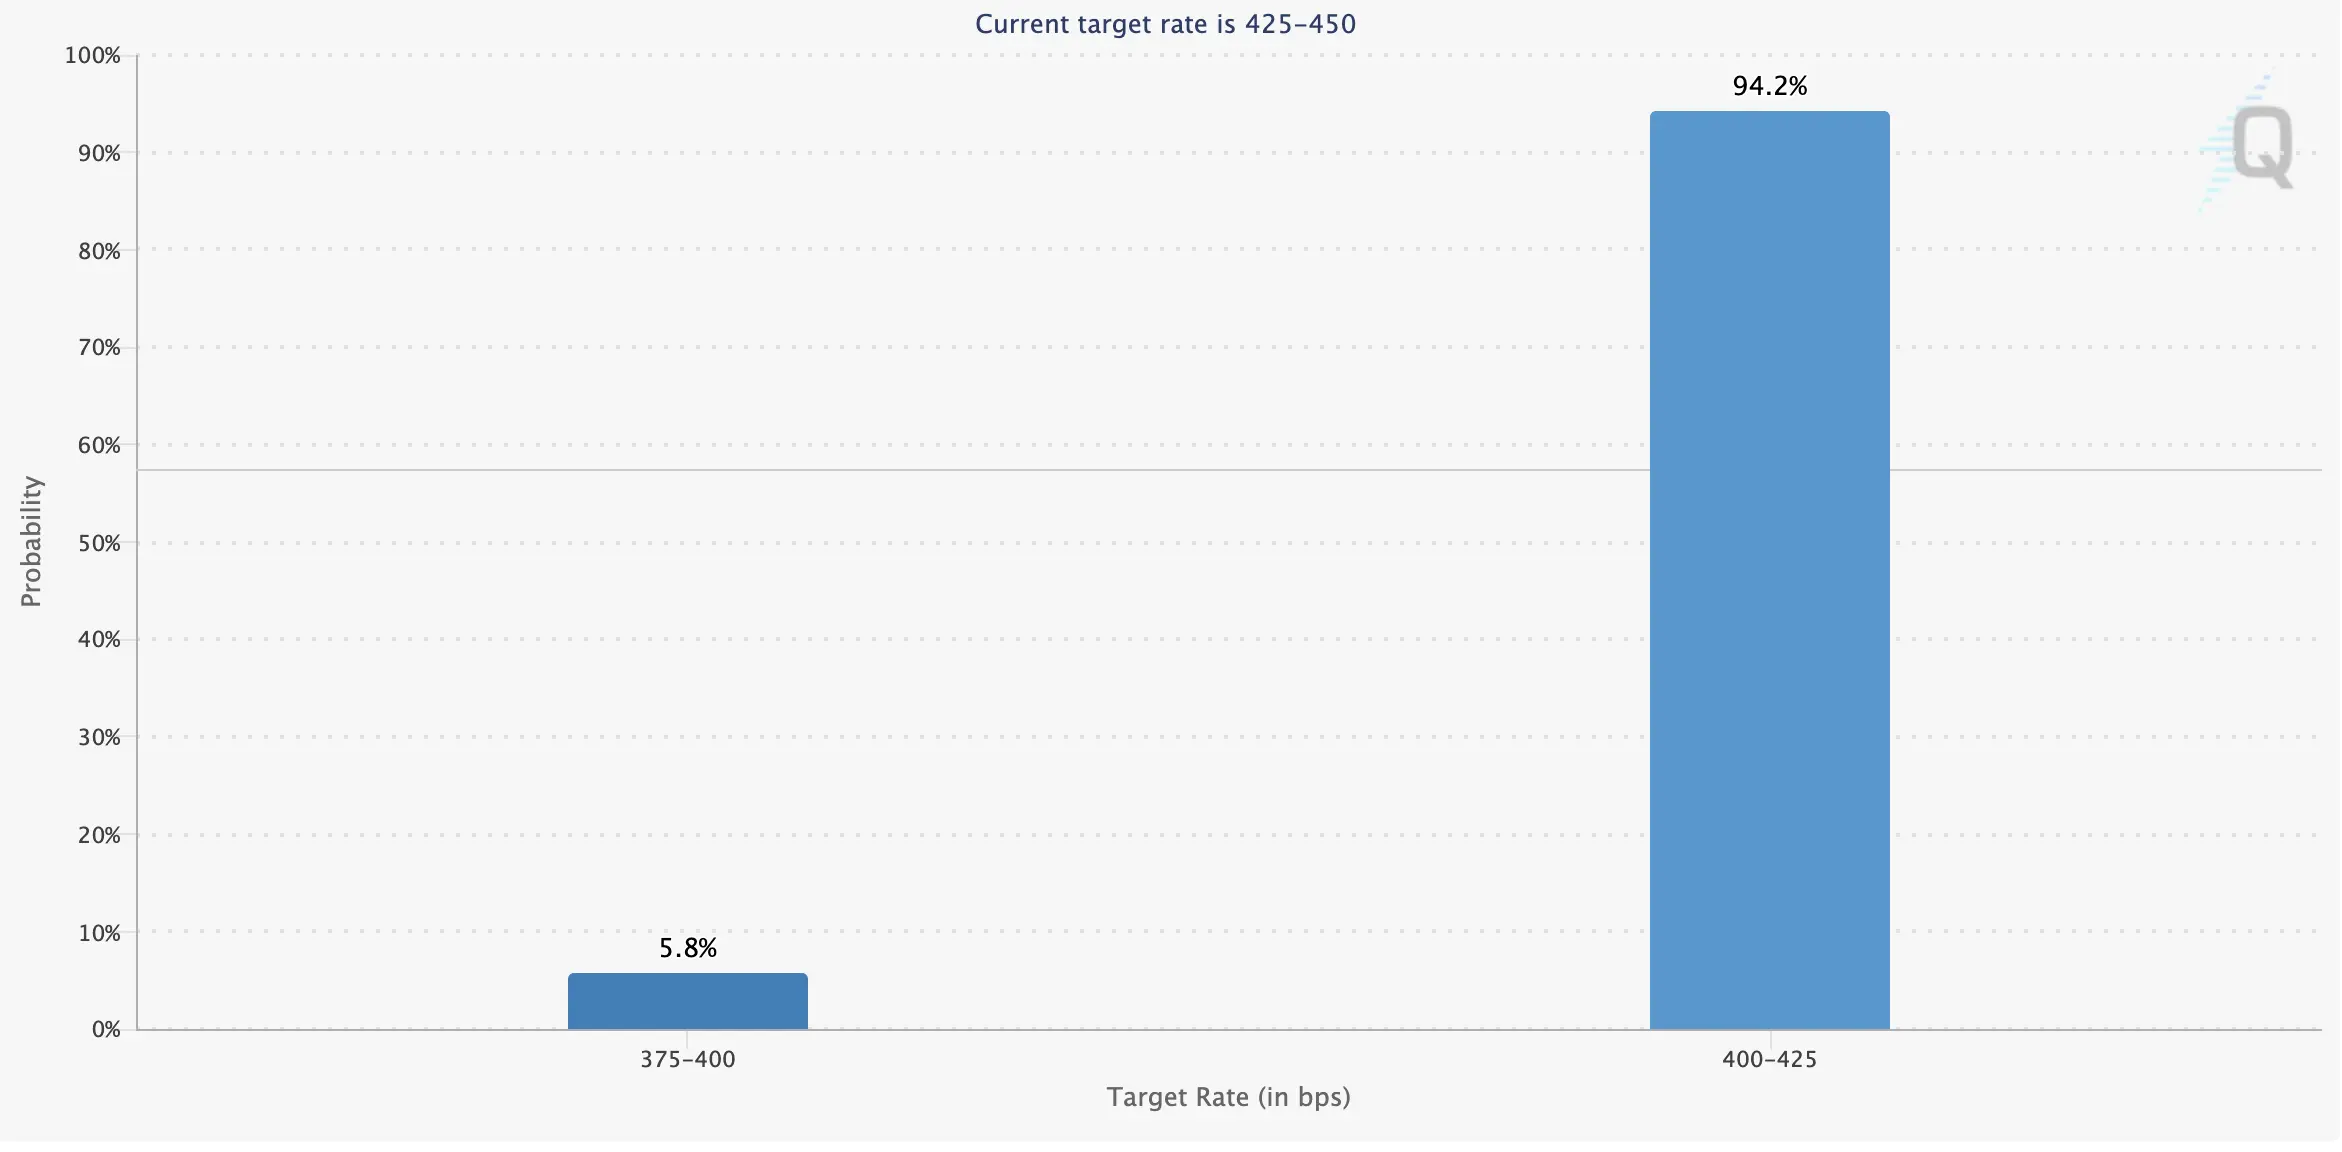
Pressure on the Fed has intensified after weak labor data: in August, nonfarm payrolls grew by just 22,000 versus expectations of 70,000, while unemployment rose to 4.3%. At the same time, inflation accelerated to 2.9% y/y and 0.4% m/m, signaling risks of economic slowdown and uncertainty around monetary policy.
Despite these concerns, Bitcoin remains supported by continued ETF inflows, with $642 million added on September 12, extending a five-day streak of capital entries. Ethereum ETFs attracted $405 million the same day. For institutions and pension funds, ETFs provide an efficient gateway to digital gold, strengthening liquidity and reducing reliance on index committee decisions.
Last week, U.S. lawmakers introduced bill H.R. 5166 in the House of Representatives, mandating the Treasury Department to design a strategic Bitcoin reserve and national digital asset holdings in line with President Donald Trump’s directive. Treasury Secretary Scott Bessent is tasked with presenting detailed protocols for custody, inter-agency transfers, and security. Experts say such a framework could set industry standards and establish institutional guidelines for crypto custodians.
Support and Resistance Levels
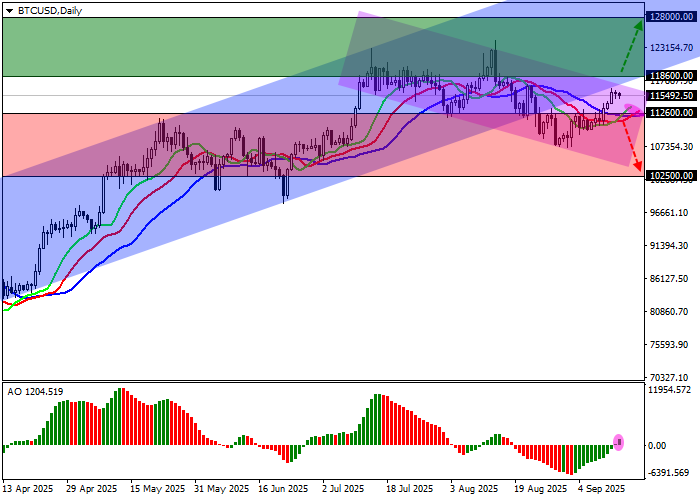
On the daily chart, BTC/USD is trading in a corrective trend along the ascending channel support at 140,000.00–117,000.00.
Technical indicators suggest a potential reversal to the upside: the fast EMAs on the Alligator indicator have crossed the signal line from below and are beginning to widen, while the AO histogram has shifted into the buy zone but remains close to the zero line.
Resistance levels: 118,600.00, 128,000.00.
Support levels: 112,600.00, 102,500.00.
Bitcoin Trading Scenarios and Forecast
If the price breaks and holds above 118,600.00, long positions will be relevant with a target of 128,000.00. Stop-loss — 115,000.00. Timeframe: 7 days or more.
If the pair reverses and consolidates below 112,600.00, short positions will be relevant with a target of 102,500.00. Stop-loss — 116,000.00.
Scenario
| Timeframe | Weekly |
| Recommendation | BUY STOP |
| Entry Point | 118,600.00 |
| Take Profit | 128,000.00 |
| Stop Loss | 115,000.00 |
| Key Levels | 102,500.00, 112,600.00, 118,600.00, 128,000.00 |
Alternative Scenario
| Recommendation | SELL STOP |
| Entry Point | 112,600.00 |
| Take Profit | 102,500.00 |
| Stop Loss | 116,000.00 |
| Key Levels | 102,500.00, 112,600.00, 118,600.00, 128,000.00 |
