

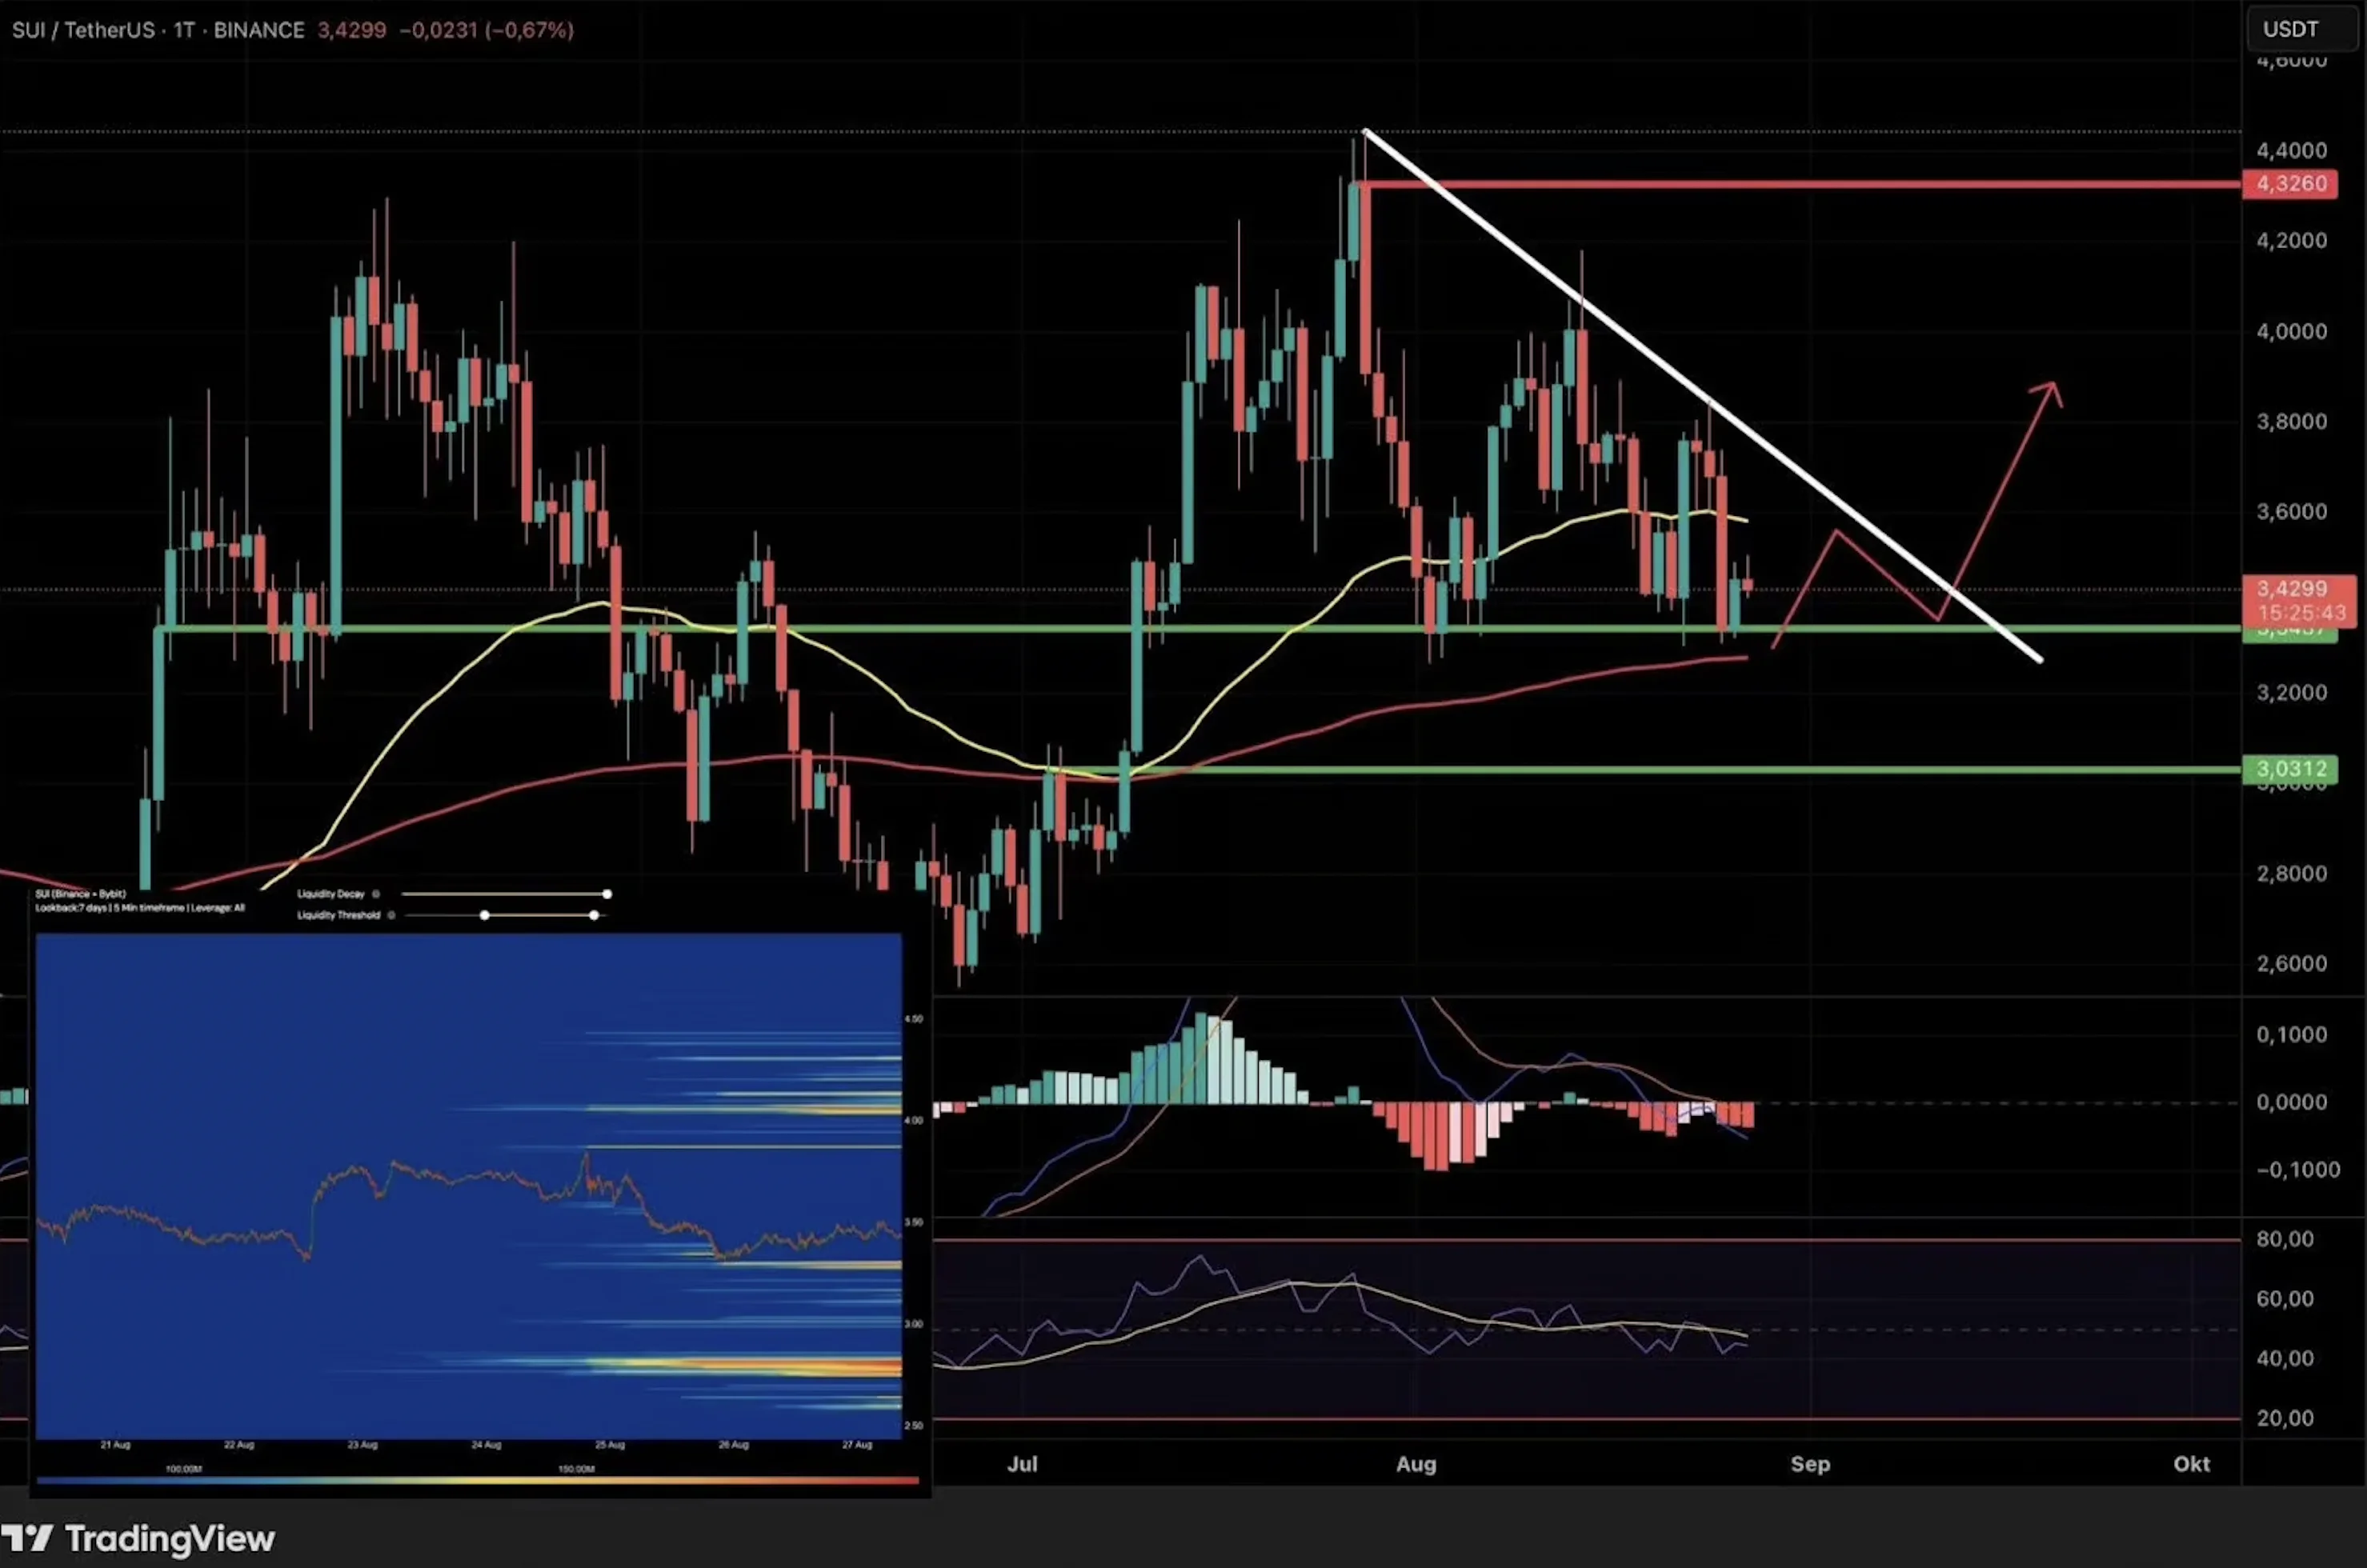
On the upside, the price first needs to reclaim the 50-day EMA and then break above the white diagonal resistance line with confirmation. Only such a breakout would open the door to a more clearly bullish scenario.
Liquidity remains a major factor. Below the current price sits a dense block of open liquidations that could pull the market lower. Indicators are mixed: the MACD suggests negative momentum is fading, hinting at a possible base, while the RSI remains below 50 and would need to regain that level to generate fresh upward momentum.
Short-term development also depends heavily on Bitcoin. If Bitcoin shows sustained strength again, it could give SUI the support needed to move higher.
The 4-hour view is clearer. If the current support holds, a potential W pattern could form, which would be interpreted as bullish. A break of this support together with a drop below the 800 EMA would, by contrast, likely trigger a move back toward the lower support zone.
Positively, the MACD is showing signs of turning from negative to positive, which could support a short-term bounce. Liquidation data also aligns with this: in the current price range, many long positions have already been liquidated to the downside, creating short-delta dominance. This market mechanic could underpin a technical counter-move higher.
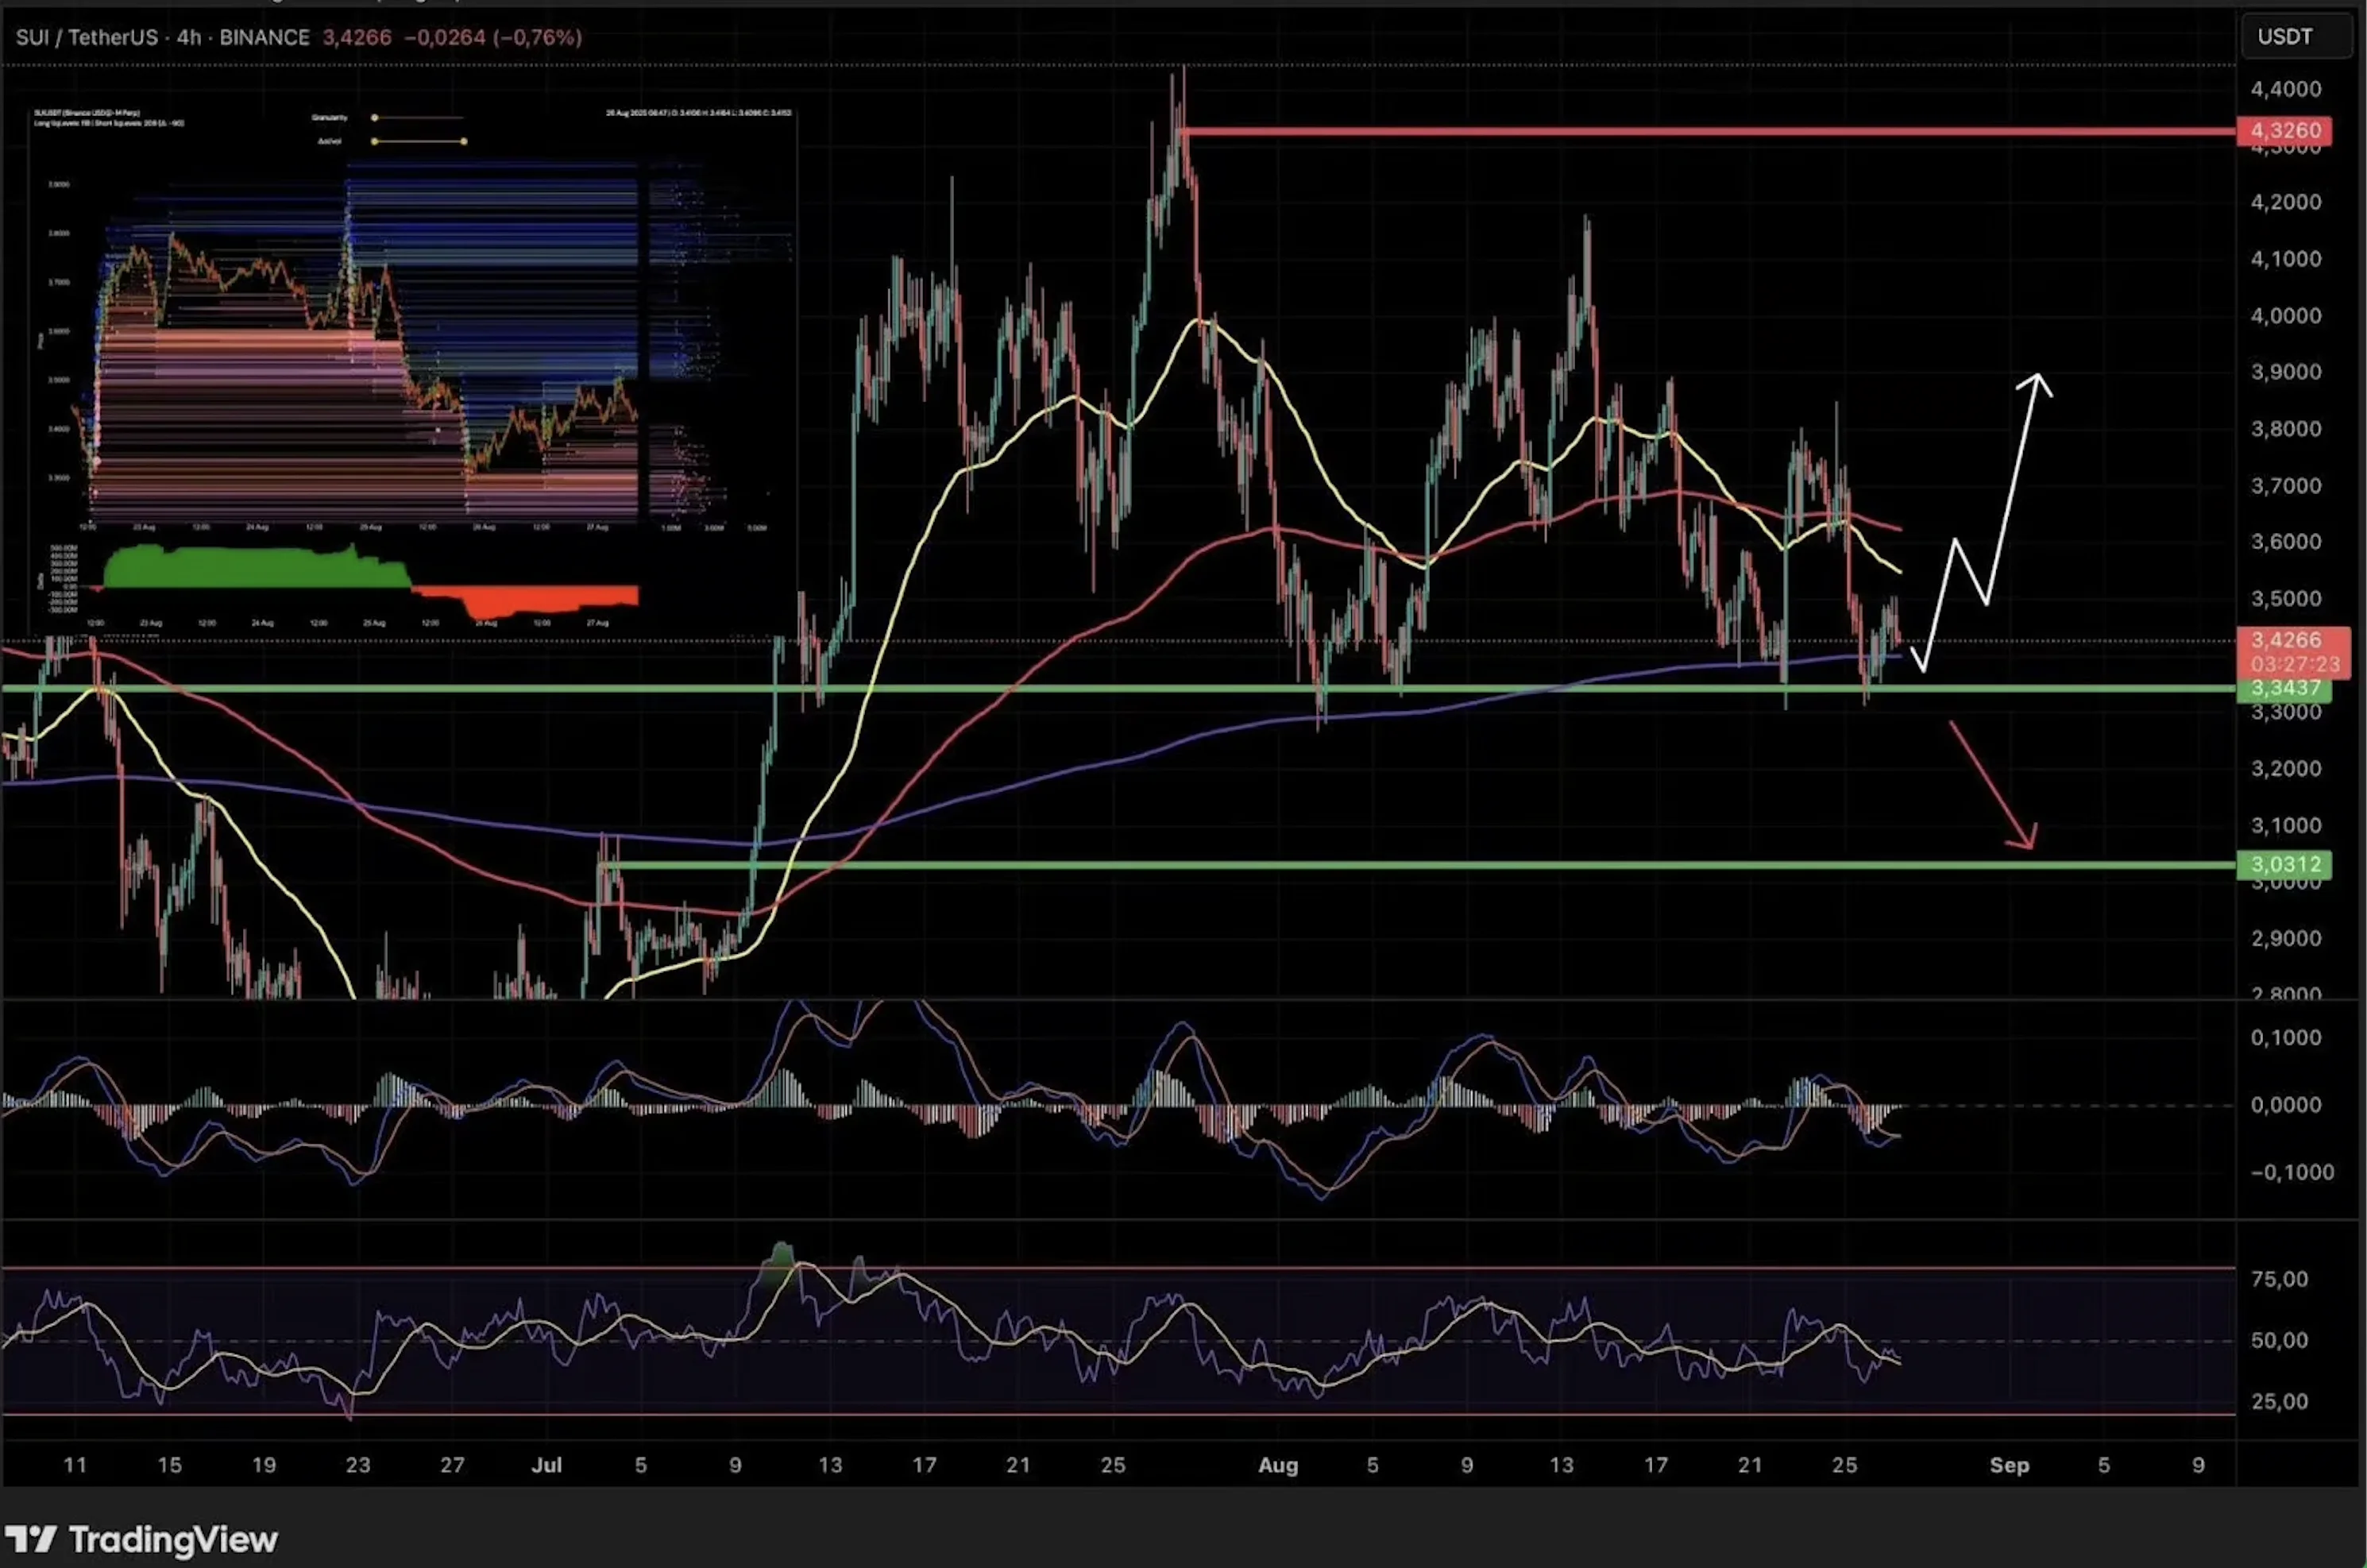
The market is therefore at a pivotal point. If support is defended, a W pattern with corresponding upside potential is possible. If the zone breaks, lower supports are the more probable target.
