
As before, investors are closely monitoring developments in the Middle East conflict, which still shows no clear signs of imminent de-escalation. At the same time, markets remain cautious about statements from U.S. President Donald Trump claiming that the “war is close to ending.” Mutual strikes on Iranian territory and U.S. military bases in the region continue, while the Strait of Hormuz remains effectively closed, directly affecting energy price dynamics. Significant volumes of other goods also pass through this maritime route, particularly nitrogen fertilizers produced from natural gas. Disruptions to these supplies could trigger rising food prices and even shortages, which would hit the poorest countries hardest, according to participants of the United Nations Conference on Trade and Development (UNCTAD).
Economic data released from the United States yesterday failed to reverse the dominant geopolitical trend. The U.S. Department of Labor reported that initial jobless claims fell by 1.0 thousand to 213.0 thousand for the week ending March 7, beating the forecast of 215.0 thousand. Economists view this indicator as evidence that the sharp drop in employment in February (by 92.0 thousand jobs) was more likely a temporary deviation rather than the beginning of a sustained trend. The U.S. labor market therefore remains relatively stable, allowing the Federal Reserve to maintain interest rates around 3.50–3.75%. Meanwhile, continuing claims declined from 1.871 million to 1.85 million, also meeting expectations.
Market participants also focused on data regarding new home construction. In January, housing starts rose by 7.2% following a 4.8% correction in the previous month. In absolute terms, the number of new housing units increased from 1.387 million to 1.487 million, while investors had expected a slowdown to around 1.350 million. The U.S. Department of Commerce also reported that the country’s trade deficit narrowed by 18.2% in January to 54.5 billion dollars, marking the lowest level since October. This was mainly driven by a record 5.5% increase in exports to 3.021 billion dollars, combined with a 0.7% decline in imports.
Today at 09:45 (GMT+2) and 10:00 (GMT+2), the market will focus on February inflation reports from France and Spain. Monthly inflation is expected to rise from –0.3% to 0.7% in France and from –0.4% to 0.4% in Spain. At the same time, the annual indicators may adjust from 0.3% to 0.1% and stabilize around 2.3%, respectively. However, investors are likely to wait for the March data releases, as the current statistics do not yet reflect the sharp increase in energy prices.
In the United States, final fourth-quarter GDP data will be released at 14:30 (GMT+2). The figure is expected to remain around 1.4%. Markets will also receive data on the Personal Consumption Expenditures (PCE) price index, which tracks changes in the cost of goods and services purchased for personal consumption excluding food and energy. On a monthly basis, the indicator is expected to adjust from 0.4% to 0.3%, while the annual figure may rise from 2.8% to 2.9%. The core indicator may change from 0.9% to 0.5% month-on-month and from 3.0% to 3.1% year-on-year.
Support and Resistance Levels
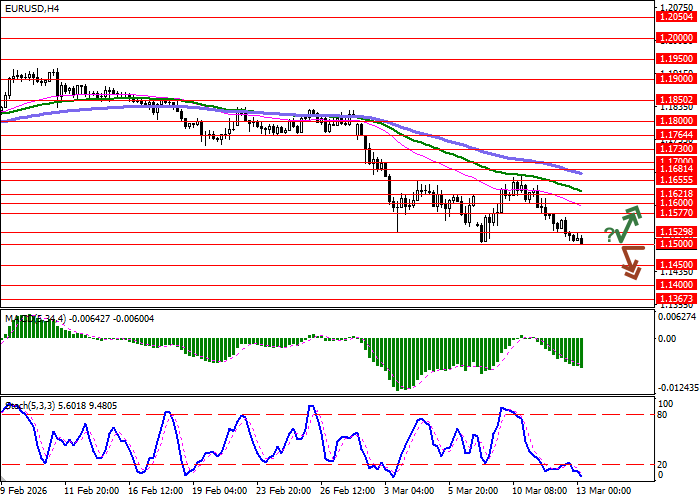
On the daily chart, Bollinger Bands continue to move downward confidently: the price range is expanding to the downside, giving bears room to push toward new lows. MACD strengthens the sell signal, remaining significantly below the signal line. Stochastic shows a similar pattern but is rapidly approaching its lower levels, indicating the risk of short-term oversold conditions for the euro.
Resistance levels: 1.1529, 1.1577, 1.1600, 1.1621.
Support levels: 1.1500, 1.1450, 1.1400, 1.1367.
Trading Scenarios and EUR/USD Forecast
Short positions may be opened after a confident breakout below the 1.1500 level with a target at 1.1400. Stop loss — 1.1550. Implementation period: 1–2 days.
A rebound from the 1.1500 support level followed by a breakout above 1.1577 could signal the opening of long positions with a target at 1.1700. Stop loss — 1.1500.
Scenario
| Timeframe | Intraday |
| Recommendation | SELL STOP |
| Entry Point | 1.1495 |
| Take Profit | 1.1400 |
| Stop Loss | 1.1550 |
| Key Levels | 1.1367, 1.1400, 1.1450, 1.1500, 1.1529, 1.1577, 1.1600, 1.1621 |
Alternative Scenario
| Recommendation | BUY STOP |
| Entry Point | 1.1580 |
| Take Profit | 1.1700 |
| Stop Loss | 1.1500 |
| Key Levels | 1.1367, 1.1400, 1.1450, 1.1500, 1.1529, 1.1577, 1.1600, 1.1621 |
