
The US labour market is showing signs of cooling, with nonfarm payroll growth slowing from 114.0 thousand to 57.0 thousand in June, while inflation remains well above the US Federal Reserve’s 2.0% target, having reached 4.2% in May. Given the regulator’s dual mandate, officials are being forced to decide which of these issues should be addressed first. Most experts expect reducing price pressure to remain the priority, a view supported by the minutes of the latest Federal Open Market Committee (FOMC) meeting. According to the document, the Board considers the risk of a further rise in consumer prices to be significantly higher than the risk of weaker employment growth and is prepared to tighten monetary policy if necessary. In the near term, inflation may continue to rise amid escalating geopolitical tensions in the Middle East, the risk of another closure of the Strait of Hormuz and a deepening energy crisis. The corresponding June data will be released on Tuesday at 14:30 (GMT+2). If the indicator accelerates or remains unchanged, the probability of an interest rate increase by September will rise significantly, supporting the US dollar.
Inflation in the European economy remains considerably lower than in the United States. In June, the core Consumer Price Index stood at 2.4%, while the headline rate reached 2.8%, suggesting that the European Central Bank (ECB) may avoid increasing borrowing costs this year. However, a renewed conflict in the Persian Gulf region could force European policymakers to consider monetary tightening, particularly if consumer prices begin to rise again. In this context, it is worth noting the latest comments from Bank of Greece Governor Yannis Stournaras, who said yesterday that uncertainty surrounding monetary policy was increasing.
Support and resistance levels
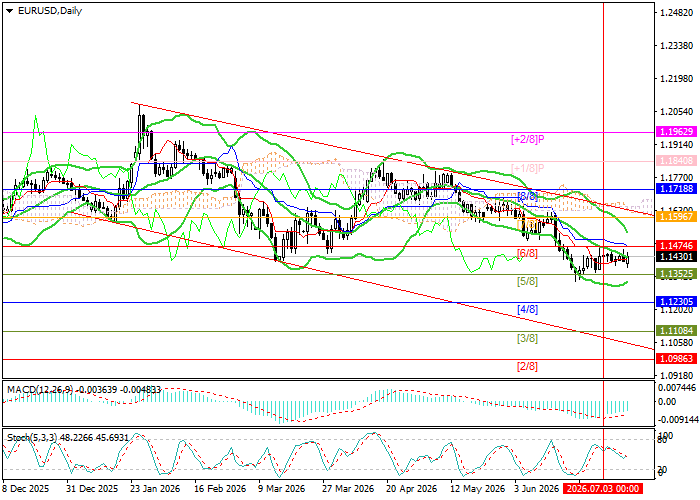
The trading instrument is moving within a descending channel but has currently entered a sideways range of 1.1460–1.1380. A consolidation below 1.1352 (Murray level [5/8]), which was tested last month, could lead to a decline towards 1.1230 (Murray level [4/8]), 1.1108 (Murray level [3/8]) and 1.0986 (Murray level [2/8]). However, a breakout above the upper Bollinger Band at 1.1596 (Murray level [7/8]) could signal a trend reversal and open the way towards 1.1840 (Murray level [+1/8]) and 1.1962 (Murray level [+2/8]).
Technical indicators continue to provide a sell signal: the Bollinger Bands and the Stochastic oscillator are turning lower, while the MACD histogram remains stable in negative territory.
Resistance levels: 1.1596, 1.1840, 1.1962.
Support levels: 1.1352, 1.1230, 1.1108, 1.0986.
EUR/USD Trading Scenarios and Exchange Rate Forecast
Short positions may be opened below 1.1352 with targets at 1.1230, 1.1108 and 1.0986 and a stop-loss at 1.1440. Implementation period: 5–7 days.
Long positions may be opened above 1.1596 with targets at 1.1840 and 1.1962 and a stop-loss at 1.1510.
Scenario
| Timeframe | Weekly |
| Recommendation | SELL STOP |
| Entry point | 1.1350 |
| Take Profit | 1.1230, 1.1108, 1.0986 |
| Stop Loss | 1.1440 |
| Key levels | 1.0986, 1.1108, 1.1230, 1.1352, 1.1596, 1.1840, 1.1962 |
Alternative Scenario
| Recommendation | BUY STOP |
| Entry point | 1.1600 |
| Take Profit | 1.1840, 1.1962 |
| Stop Loss | 1.1510 |
| Key levels | 1.0986, 1.1108, 1.1230, 1.1352, 1.1596, 1.1840, 1.1962 |
