

On Tuesday, three commercial vessels, including a Qatari liquefied natural gas tanker and a Saudi oil tanker, were attacked in the Strait of Hormuz. US Central Command (CENTCOM) described the incident as “unjustified, dangerous and clear aggression that violates the ceasefire regime” and carried out a series of airstrikes on Iranian facilities. More than 80 targets were hit with precision-guided munitions, including air-defence systems, launchers for anti-aircraft missile systems and anti-ship missiles, coastal surveillance systems, drone launch sites and port facilities near Bandar Abbas, Sirik and Qeshm Island. In response, the Islamic Revolutionary Guard Corps (IRGC) attempted to destroy US military bases in Bahrain and Kuwait. The US Treasury Department also revoked a licence issued only a few days earlier, on June 30, that had allowed Iran to export hydrocarbons to global markets. Analysts now believe that issuing a new permit could take significantly longer, even if the parties return to the negotiating table.
Markets reacted immediately to the escalation of the conflict: the price of benchmark Brent Crude Oil rose by 5.0% in a single session, breaking above 75.67, while WTI Crude Oil returned above 72.00. Today, growth continued: the indicator gained around 2.9%, while Brent Crude Oil quotations reached 75.75. The rise in “black gold” prices once again intensified concerns over persistent inflation, leading to a revision of expectations for tighter US Federal Reserve monetary policy. According to the CME FedWatch Tool, the probability of a 25-basis-point interest-rate hike in September increased from 57.0% to 67.0%, while the probability of at least one borrowing-cost adjustment before the end of the year rose to 80%. Against this backdrop, US Treasury yields also moved higher: 10-year bonds rose yesterday to 4.567%, while two-year bonds, which are more sensitive to credit conditions, climbed to 4.189%.
Today, investors are focused on the publication of the minutes from the June FOMC meeting, scheduled for 20:00 (GMT+2). Since Federal Reserve Chair Kevin Warsh has abandoned forward guidance, the documents are especially important as the only source of information about officials’ internal discussions. Markets will look for confirmation of how united the Federal Open Market Committee (FOMC) is in its hawkish bias and how it assesses inflation risks amid the current situation. At the June meeting, Warsh had already demonstrated a tougher stance than the market expected, which triggered a decline in gold prices. If the minutes confirm this sentiment, the dollar will receive additional support and precious metals may continue to decline.
Support and resistance levels
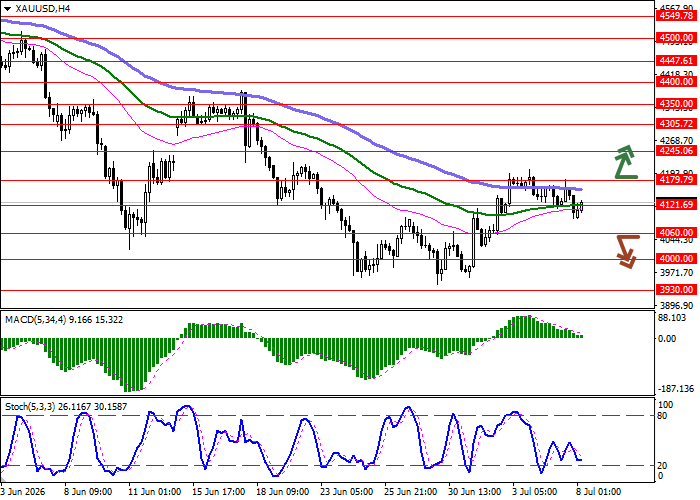
On the daily chart, the Bollinger Bands are turning horizontal: the price range is narrowing from above, reflecting the emergence of mixed dynamics in the very short term. The MACD indicator is moving downward, forming a sell signal, with the histogram attempting to move below the signal line, while the Stochastic oscillator is retreating from its highs, signalling in favour of a corrective decline in the near-term timeframes.
Resistance levels: 4179.79, 4245.06, 4305.72, 4350.00.
Support levels: 4121.69, 4060.00, 4000.00, 3930.00.
XAU/USD Trading Scenarios and Price Forecast
Long positions may be opened after a breakout above 4179.79, with a target at 4305.72. Stop-loss: 4121.69. Expected implementation period: 2–3 days.
Short positions may be opened after a breakout below 4060.00, with a target at 3930.00. Stop-loss: 4121.69.
Scenario
| Timeframe | Intraday |
| Recommendation | BUY STOP |
| Entry point | 4179.80 |
| Take Profit | 4305.72 |
| Stop Loss | 4121.69 |
| Key levels | 3930.00, 4000.00, 4060.00, 4121.69, 4179.79, 4245.06, 4305.72, 4350.00 |
Alternative Scenario
| Recommendation | SELL STOP |
| Entry point | 4059.95 |
| Take Profit | 3930.00 |
| Stop Loss | 4121.69 |
| Key levels | 3930.00, 4000.00, 4060.00, 4121.69, 4179.79, 4245.06, 4305.72, 4350.00 |
