

Stock indices around the world continue to correct amid ongoing tensions in the Middle East after Donald Trump announced the end of the ceasefire and the beginning of a new phase of military operations against Iran. This led to a renewed exchange of strikes and another increase in activity in the bond markets.
Next week, the US corporate earnings season for the second quarter and first half of 2026 will officially begin, with the banking sector starting to release its reports on Monday. JPMorgan Chase & Co. may report revenue of $49.82 billion, exceeding the $48.24 billion recorded last year. Earnings per share may reach $5.61, also above the $5.24 reported a year earlier. Bank of America Corp., the largest mortgage bank in the United States, may report revenue of $30.38 billion, below the $34.87 billion recorded in the same period last year, while earnings per share may reach $1.11, compared with $0.89 last year. Goldman Sachs Group Inc. may report revenue of $16.02 billion, above the $14.58 billion recorded in the same period last year, while earnings per share may reach $14.01, also exceeding the $10.91 reported a year earlier.
As for the bond and long-term securities market, the yield on the most popular medium-term 12-month bonds stands at 4.036% today, compared with 3.945% last Friday. The yield on benchmark 10-year US Treasuries has risen from 4.468% at the end of last week to 4.536% at present. More conservative 20-year US bonds are trading at a yield of 5.064%, slightly above the 5.004% recorded last Friday. The yield on 30-year bonds is also increasing, holding at 5.056%, compared with 4.988% at the end of last week.
The leading gainers include Hewlett Packard Enterprise Co. (+9.94%), Norwegian Cruise Line Holdings Ltd. (+6.98%), Lam Research Corp. (+6.01%), Invesco Plc. (+5.85%) and AMD Inc. (+5.67%).
The leading decliners include APA Corp. (-5.05%), Paramount Skydance Corp. (-4.31%), Costco Wholesale Corp. (-4.21%), Cincinnati Financial Corp. (-3.38%) and PepsiCo Inc. (-3.26%).
Support and Resistance Levels
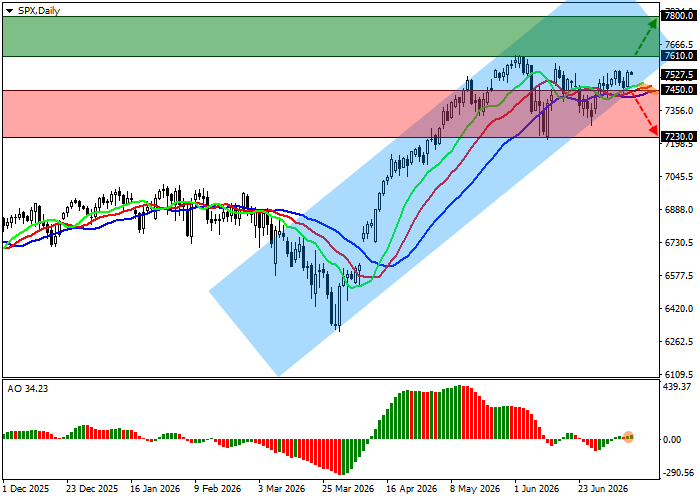
The index continues to correct, and on the daily chart it remains within a corrective trend, making another local attempt to approach the lower boundary of the ascending channel with limits at 7800.0–7500.0.
Technical indicators are showing an unstable buy signal, which remains in place despite the local correction. The fast EMAs of the Alligator indicator remain above the signal line, while the AO oscillator histogram, still in the buy zone, continues to form corrective bars.
Support levels: 7450.0, 7230.0.
Resistance levels: 7610.0, 7800.0.
S&P 500 Trading Scenarios and Price Forecast
If the asset resumes its broader upward movement and the price consolidates above the local resistance level of 7610.0, buy positions may become relevant with a potential target of 7800.0. The stop-loss should be placed at 7510.0. Implementation period: seven days or more.
If the asset continues to decline and the price consolidates below the local support level of 7450.0, sell positions may become relevant with a target of 7230.0. The stop-loss should be set at 7550.0.
Scenario
| Timeframe | Weekly |
| Recommendation | BUY STOP |
| Entry Point | 7610.5 |
| Take Profit | 7800.0 |
| Stop Loss | 7510.0 |
| Key Levels | 7230.0, 7450.0, 7610.0, 7800.0 |
Alternative Scenario
| Recommendation | SELL STOP |
| Entry Point | 7449.5 |
| Take Profit | 7230.0 |
| Stop Loss | 7550.0 |
| Key Levels | 7230.0, 7450.0, 7610.0, 7800.0 |
