

It should be noted that the data does not fully reflect the current situation, as it does not include the impact of geopolitical tensions in the Middle East, which have already led to a sharp increase in gasoline prices to 3.34–3.50 dollars per gallon. In California, where fuel prices are traditionally the highest in the country, the indicator even reached 5.2 dollars, exceeding the April peak of 5.0 dollars. Analysts believe that if the Strait of Hormuz remains blocked for a prolonged period, gasoline prices could climb to around 4.12 dollars nationwide, placing direct pressure on household consumer spending. As a result, investors are currently not seriously considering the possibility of borrowing cost reductions. According to the Chicago Mercantile Exchange (CME) FedWatch Tool, the Federal Reserve is expected to keep rates in the 3.50–3.75% range for at least the next three meetings. However, the probability of returning to a dovish policy cycle at the June meeting is estimated at 63.6%, significantly higher than forecasts made in mid-February.
The bond market has also reacted to the changing fundamental environment, with yields rising actively since the beginning of March. One-year Treasury yields stand at 3.616%, up from 3.556% last Friday. Ten-year yields have climbed to 4.241% from 4.134%, while 20-year and 30-year bonds are trading at 4.855% and 4.886%, respectively, compared with 4.730% and 4.762% previously.
The top gainers within the index include Caesars Entertainment Inc. (+11.76%), The Mosaic Co. (+10.08%), Oracle Corp. (+9.18%), and CF Industries Holdings Inc. (+9.16%).
The main decliners include Fair Isaac Corp. (–9.33%), The Campbell’s Co. (–7.05%), Conagra Brands Inc. (–6.08%), and International Flavors & Fragrances Inc. (–5.67%).
Support and resistance levels
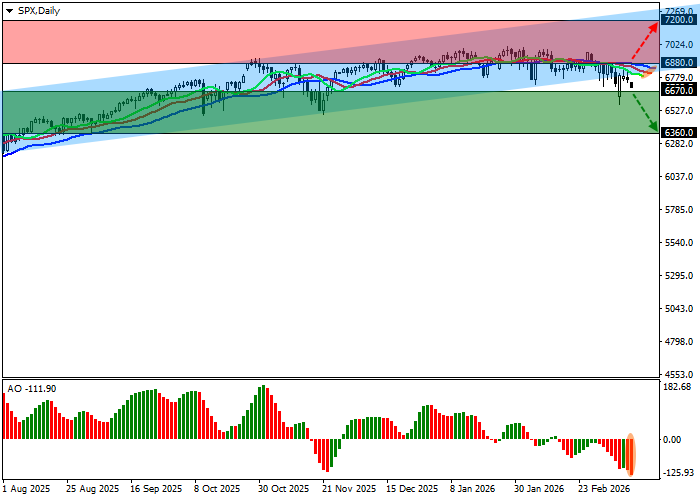
On the daily chart, quotes continue to move within a downward trend, forming a local decline attempt inside the channel of 7250.0–6800.0.
Technical indicators show an unstable sell signal that is weakening amid a local correction: the fast EMAs on the Alligator indicator are approaching the signal line, while the AO histogram remains in the sell zone but is forming corrective bars.
Support levels: 6670.0, 6360.0.
Resistance levels: 6880.0, 7200.0.
Trading scenarios and S&P 500 forecast
Short positions may be opened after the price consolidates below 6670.0 with a target at 6360.0. Stop-loss — 6760.0. Implementation period: 7 days or more.
Long positions may be opened after the price consolidates above 6880.0 with a target at 7200.0. Stop-loss — 6800.0.
Scenario
| Timeframe | Weekly |
| Recommendation | SELL STOP |
| Entry point | 6669.5 |
| Take Profit | 6360.0 |
| Stop Loss | 6760.0 |
| Key Levels | 6360.0, 6670.0, 6880.0, 7200.0 |
Alternative Scenario
| Recommendation | BUY STOP |
| Entry point | 6880.5 |
| Take Profit | 7200.0 |
| Stop Loss | 6800.0 |
| Key Levels | 6360.0, 6670.0, 6880.0, 7200.0 |
