

The US Department of Defense has reportedly requested 200.0 billion dollars for military operations, four times above the 50.0 billion dollars expected by analysts, reinforcing the view that the White House intends to continue the campaign for an extended period. At the same time, the sides, which until recently had avoided attacking oil and gas infrastructure, have now begun targeting such facilities, pushing Brent Crude Oil above 110.00 today. As a result, the probability of faster global inflation is increasing, which could force central banks, including the Federal Reserve, to maintain or even tighten monetary policy. Fed Chair Jerome Powell hinted at this during yesterday’s press conference: although the interest rate remained at 3.75%, he acknowledged that the situation in the Persian Gulf would have a lasting impact on consumer prices and raised the 2026 inflation forecast from 2.4% to 2.7%, strengthening the dollar and adding pressure on digital assets.
On the positive side, Ethereum has begun testing the Fast Confirmation Rule (FCR), a mechanism designed to reduce transaction recognition time on the Ethereum blockchain to 13.0 seconds, which is 98.0% below the current level. If implemented successfully, this could make the network more user-friendly and attract additional users and developers.
Overall, fundamental factors remain negative. The balance of Ethereum ETFs declined by 55.5 million dollars during yesterday’s session, although the weekly total still stands at 118.6 million dollars. At the same time, the Fear and Greed Index remains in the “extreme fear” zone at 23.
Support and resistance levels
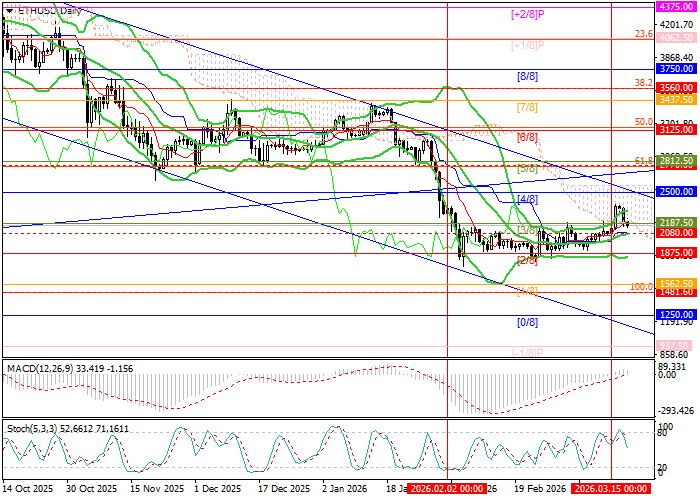
The price has returned to the boundaries of the main sideways range at 2187.50–1875.00 (Murray levels [3/8]–[2/8]), which it briefly broke above earlier this week. A breakout below 2187.50 (Murray level [3/8]) would likely open the way for further decline toward 1875.00 (Murray level [2/8], the lower Bollinger Band), 1481.60 (100.0% Fibonacci retracement), and 1250.00 (Murray level [0/8]). However, if the asset manages to move above 2500.00 (Murray level [4/8]), it could leave the long-term descending channel and target 2812.50 (Murray level [5/8], 61.8% Fibonacci retracement) and 3125.00 (Murray level [6/8], 50.0% Fibonacci retracement).
Technical indicators do not offer a unified signal. Bollinger Bands are turning upward, the MACD histogram has entered positive territory, while Stochastic is reversing lower from overbought levels. It is also important to note that prices remain within a long-term descending channel overall, while weekly Bollinger Bands continue to slope downward, confirming that the broader bearish trend remains intact. In this environment, current price action resembles the formation of a flag pattern within a downtrend, making further downside more likely.
Resistance levels: 2500.00, 2812.50, 3125.00.
Support levels: 1875.00, 1481.50, 1250.00.
Trading scenarios and ETH/USD forecast
Short positions may be considered from 2080.00 with targets at 1481.50 and 1250.00 and a stop-loss at 2250.00. Timeframe: 5–7 days.
Long positions may be considered above 2500.00 with targets at 2812.50 and 3125.00 and a stop-loss at 2315.00.
Scenario
| Timeframe | Weekly |
| Recommendation | SELL STOP |
| Entry point | 2080.00 |
| Take Profit | 1481.50, 1250.00 |
| Stop Loss | 2250.00 |
| Key levels | 1250.00, 1481.50, 1875.00, 2500.00, 2812.50, 3125.00 |
Alternative scenario
| Recommendation | BUY STOP |
| Entry point | 2510.00 |
| Take Profit | 2812.50, 3125.00 |
| Stop Loss | 2315.00 |
| Key levels | 1250.00, 1481.50, 1875.00, 2500.00, 2812.50, 3125.00 |
