

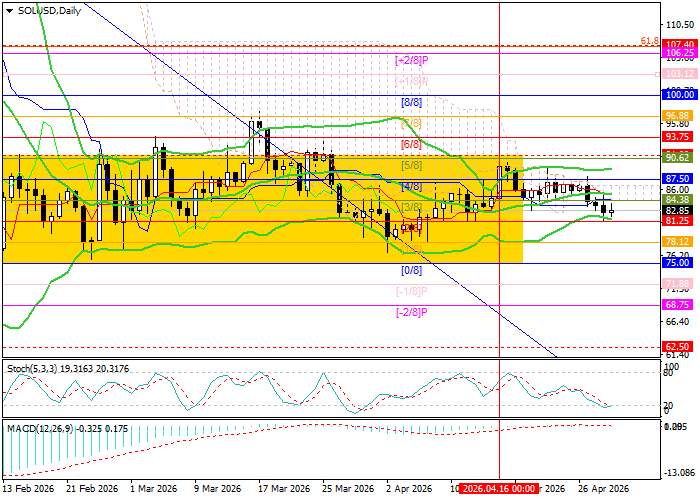
Technical indicators do not provide a unified signal, which does not rule out further sideways movement of the trading instrument: the Bollinger Bands are horizontal, the MACD histogram is near the zero line with insignificant volumes, while the Stochastic has reached the oversold zone and may soon reverse. It is also worth noting that on the weekly chart, the Bollinger Bands are still directed downward, confirming the continuation of the long-term downtrend, while signs of a forming “flag” pattern are observed, indicating a high potential for the development of a bearish impulse in the medium term.
Support and Resistance Levels
Resistance levels: 91.00, 100.00, 107.40, 125.00.
Support levels: 81.25, 75.00, 68.75, 62.50.
SOL/USD Trading Scenarios and Price Forecast
Short positions may be opened below the level of 81.25, with targets at 75.00, 68.75, and 62.50 and a stop-loss at 85.60. Time horizon: 5–7 days.
Long positions may be opened above 91.00, with targets at 100.00, 107.40, and 125.00 and a stop-loss at 84.50.
Scenario
| Timeframe | Weekly |
| Recommendation | SELL STOP |
| Entry Point | 81.00 |
| Take Profit | 75.00, 68.75, 62.50 |
| Stop Loss | 85.60 |
| Key Levels | 62.50, 68.75, 75.00, 81.25, 91.00, 100.00, 107.40, 125.00 |
Alternative Scenario
| Recommendation | BUY STOP |
| Entry Point | 91.50 |
| Take Profit | 100.00, 107.40, 125.00 |
| Stop Loss | 84.50 |
| Key Levels | 62.50, 68.75, 75.00, 81.25, 91.00, 100.00, 107.40, 125.00 |
