

On the eve of trading, the United States and Iran reached an agreement on a two-week truce, significantly easing tensions in the Middle East and raising hopes that a global economic slowdown can be avoided. The parties are expected to finalize the detailed terms of the agreement during talks in Islamabad, Pakistan. Experts have reacted to the reports with caution, since the pause in hostilities could either become a step toward de-escalation or simply allow both sides to regroup before a new round of military confrontation. In addition, negotiators may face serious complications, as a number of Iranian conditions underlying the future consultations are unacceptable to Washington. These include, in particular, demands for reparations for damage caused during the operation. The situation around transit through the Strait of Hormuz also remains uncertain: it is assumed that passage will remain open during the stated period, but later vessel transit may be subject to an Iranian duty, increasing transportation costs. Nevertheless, demand for cryptocurrency assets remains elevated for now.
Today, a new spot Bitcoin ETF from Morgan Stanley is set to launch on the New York Stock Exchange, and it may eventually become one of the largest instruments of its kind. The fund will be called Morgan Stanley Bitcoin Trust and will trade under the ticker #MSBT. Experts note that one of the largest investment firms in the United States is entering a market where competing products such as BlackRock’s iShares Bitcoin Trust (IBIT) and Fidelity Wise Origin Bitcoin Fund (FBTC) are already operating. According to Farside Investors, since their launch in January 2024, these funds have collectively attracted $74.3 billion. MSBT could eventually surpass them by attracting clients with one of the lowest fees in the market at 0.14%. In any case, the launch of a new exchange-traded instrument by such a major financial player should strengthen the institutionalization of cryptocurrency assets.
Overall, sentiment toward digital assets is improving at the moment: the Fear and Greed Index has risen to 17, a three-week high, although it remains in the “extreme fear” zone.
Support and resistance levels
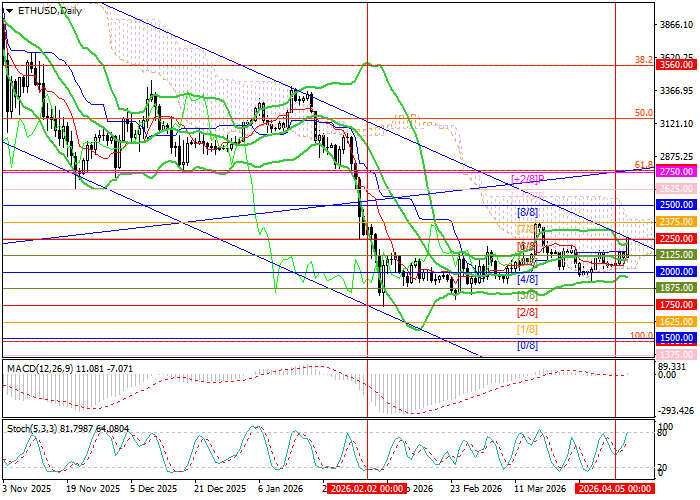
The trading instrument has moved up to the upper boundary of the long-term descending channel at 2250.00 (Murray level [6/8]). If the price consolidates above this level, further growth toward 2500.00 (Murray level [8/8]) and 2750.00 (Murray level [+2/8], 61.8% Fibonacci retracement) is expected. However, if the price breaks below 2000.00 (Murray level [4/8]), a renewed decline toward 1750.00 (Murray level [2/8]) and 1500.00 (Murray level [1/8]) becomes likely.
Technical indicators do not provide a unified signal: Bollinger Bands have shifted into horizontal movement, the MACD histogram remains near the zero line with low volumes, and Stochastic has reached the overbought zone and may turn downward. In addition, Bollinger Bands on the weekly chart are directed downward, confirming that the long-term negative trend remains in place. Under these conditions, price action resembles the formation of a flag pattern within a downtrend, signaling the possibility of a medium-term decline.
Resistance levels: 2250.00, 2500.00, 2750.00.
Support levels: 2000.00, 1750.00, 1500.00.
Trading scenarios and ETH/USD forecast
Short positions may be opened below the level of 2000.00 or upon a price reversal in the area of 2500.00, with targets at 1750.00 and 1500.00, and stop-losses around 2165.00 and 2680.00, respectively. Expected implementation period: 5-7 days.
Scenario
| Timeframe | Weekly |
| Recommendation | SELL STOP |
| Entry Point | 1990.00 |
| Take Profit | 1750.00, 1500.00 |
| Stop Loss | 2165.00 |
| Key Levels | 1500.00, 1750.00, 2000.00, 2250.00, 2500.00, 2750.00 |
Alternative Scenario
| Recommendation | SELL LIMIT |
| Entry Point | 2500.00 |
| Take Profit | 1750.00, 1500.00 |
| Stop Loss | 2680.00 |
| Key Levels | 1500.00, 1750.00, 2000.00, 2250.00, 2500.00, 2750.00 |
