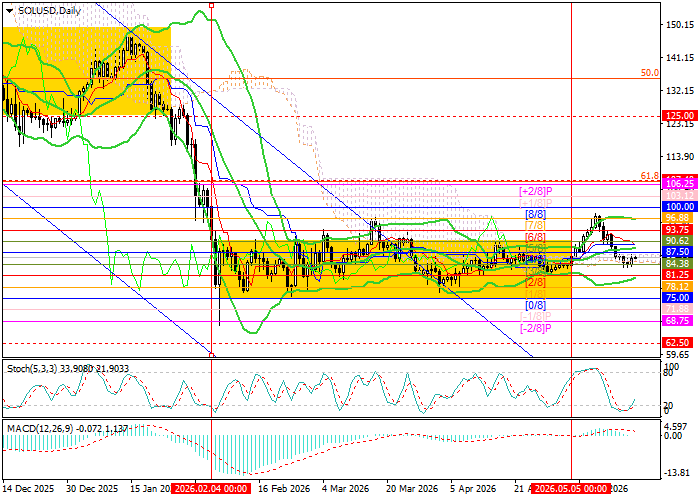
At the beginning of the month, the SOL/USD pair attempted to break out of the medium-term sideways range of 91.00–75.00, moving through its upper boundary. The price reached a four-month high near 98.30, but then lost all of its gains and pulled back to 84.38, the Murray level [3/8]. Overall, the market has likely reached a local bottom, but there are still no clear drivers for a confident recovery, which suggests that the pair may continue moving within a broader sideways range of 100.00–75.00. A breakout above 92.62, the Murray level [5/8], supported by the middle line of the Bollinger Bands, would strengthen the bullish impulse and allow buyers to consolidate around 100.00, the Murray level [8/8], 107.40, the 61.8% Fibonacci retracement, and 125.00, the Murray level [4/8] on W1. Meanwhile, a break below 81.25, the Murray level [2/8] and the lower line of the Bollinger Bands, would act as a catalyst for a test of 75.00, the Murray level [0/8], 68.75, the Murray level [–2/8], and 62.50, the Murray level [2/8] on W1.
Technical indicators do not provide a unified signal: the Bollinger Bands and the Stochastic are turning upward, while the MACD histogram is preparing to move into the negative zone. It is also worth noting that, on the weekly chart, the Bollinger Bands are still pointing downward, confirming the continuation of the long-term downtrend. However, a trend reversal cannot be ruled out, as the price is preparing to test the middle line of the Bollinger Bands at 93.75, the Murray level [3/8] on W1.
Support and resistance levels
Resistance levels: 92.62, 100.00, 107.40, 125.00.
Support levels: 81.25, 75.00, 68.75, 62.50.
Trading scenarios and SOL/USD forecast
Long positions can be opened above 92.62 with targets at 100.00, 107.40 and 125.00, and a stop-loss at 87.70. Expected timeframe: 5–7 days.
Short positions may be opened below 81.25 with targets at 75.00, 68.75 and 62.50, and a stop-loss at 85.40.
Scenario
| Timeframe |
Weekly |
| Recommendation |
BUY STOP |
| Entry point |
92.67 |
| Take Profit |
100.00, 107.40, 125.00 |
| Stop Loss |
87.70 |
| Key levels |
62.50, 68.75, 75.00, 81.25, 92.62, 100.00, 107.40, 125.00 |
Alternative scenario
| Recommendation |
SELL STOP |
| Entry point |
81.22 |
| Take Profit |
75.00, 68.75, 62.50 |
| Stop Loss |
85.40 |
| Key levels |
62.50, 68.75, 75.00, 81.25, 92.62, 100.00, 107.40, 125.00 |
John Isige is an experienced cryptocurrency journalist and market analyst specializing in digital assets, blockchain innovation, and emerging Web3 trends. He provides clear, actionable market insights for traders and investors, with particular expertise in DeFi, smart contracts, NFTs, RWAs, and AI-powered blockchain ecosystems. His commentary and analysis have been featured in FORECK.INFO, CoinGape, CryptoNews, and other leading digital finance publications