

A breakdown below this area could trigger a renewed decline towards 1500.00 (Murray level [0/8], 100.0% Fibonacci retracement) and 1250.00 (Murray level [-2/8]). The key level for buyers is 2000.00 (Murray level [4/8], the middle line of the Bollinger Bands on the weekly chart). A consolidation above this mark could signal the formation of a new uptrend and open the way towards 2500.00 (Murray level [8/8]) and 2750.00 (Murray level [+2/8], 61.8% Fibonacci retracement). Technical indicators are not providing a unified signal. The Bollinger Bands are turning upwards, while the MACD histogram has entered positive territory. However, the Stochastic oscillator has reversed lower from the overbought zone. It is also worth noting that the Bollinger Bands on the weekly chart remain directed downwards, confirming that the long-term bearish trend is still in place. Under these conditions, a limited corrective rise remains possible, but the broader downtrend is unlikely to change in the near term.
Support and resistance levels
Resistance levels: 2000.00, 2500.00, 2750.00.
Support levels: 1700.00, 1500.00, 1250.00.
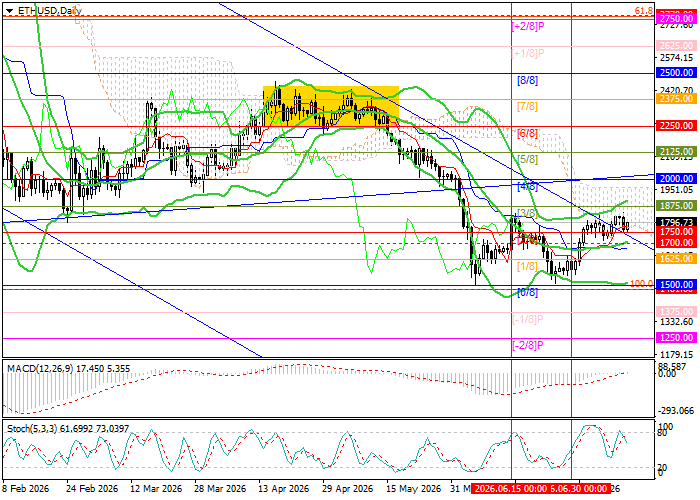
ETH/USD Trading Scenarios and Price Forecast
Short positions may be opened below 1700.00 or after a price reversal near 2000.00, with targets at 1500.00 and 1250.00 and stop-losses at 1850.00 and 2150.00, respectively. Implementation period: 5–7 days.
Scenario
| Timeframe | Weekly |
| Recommendation | SELL STOP |
| Entry point | 1700.00 |
| Take Profit | 1500.00, 1250.00 |
| Stop Loss | 1850.00 |
| Key levels | 1250.00, 1500.00, 1700.00, 2000.00, 2500.00, 2750.00 |
Alternative Scenario
| Recommendation | SELL LIMIT |
| Entry point | 2000.00 |
| Take Profit | 1500.00, 1250.00 |
| Stop Loss | 2150.00 |
| Key levels | 1250.00, 1500.00, 1700.00, 2000.00, 2500.00, 2750.00 |