

In recent days, Render has emerged as one of the main beneficiaries of the renewed AI narrative in the cryptocurrency market. The catalyst was a report about Nvidia’s upcoming open-source platform NemoClaw, which is expected to allow companies to deploy autonomous AI agents capable of handling complex tasks.
As a decentralized GPU infrastructure, Render is closely tied to the narrative surrounding artificial intelligence, computing power, and the DePIN segment. For this reason, the token tends to react strongly to such headlines. Expectations of growing demand for flexible compute capacity are currently providing additional support for the RNDR price.
RNDR Technical Analysis
Over the past 12–24 hours, the price of Render has traded in a range between 1.489$ and 1.611$. The current closing price stands at around 1.61$, noticeably higher than the previous level of 1.503$. The project’s market capitalization is currently estimated at approximately 800 million$.
The price remains confidently above the EMA-20, which is located near 1.48763$. In addition, the sequence of higher highs and higher lows in recent candles signals short-term buyer strength.
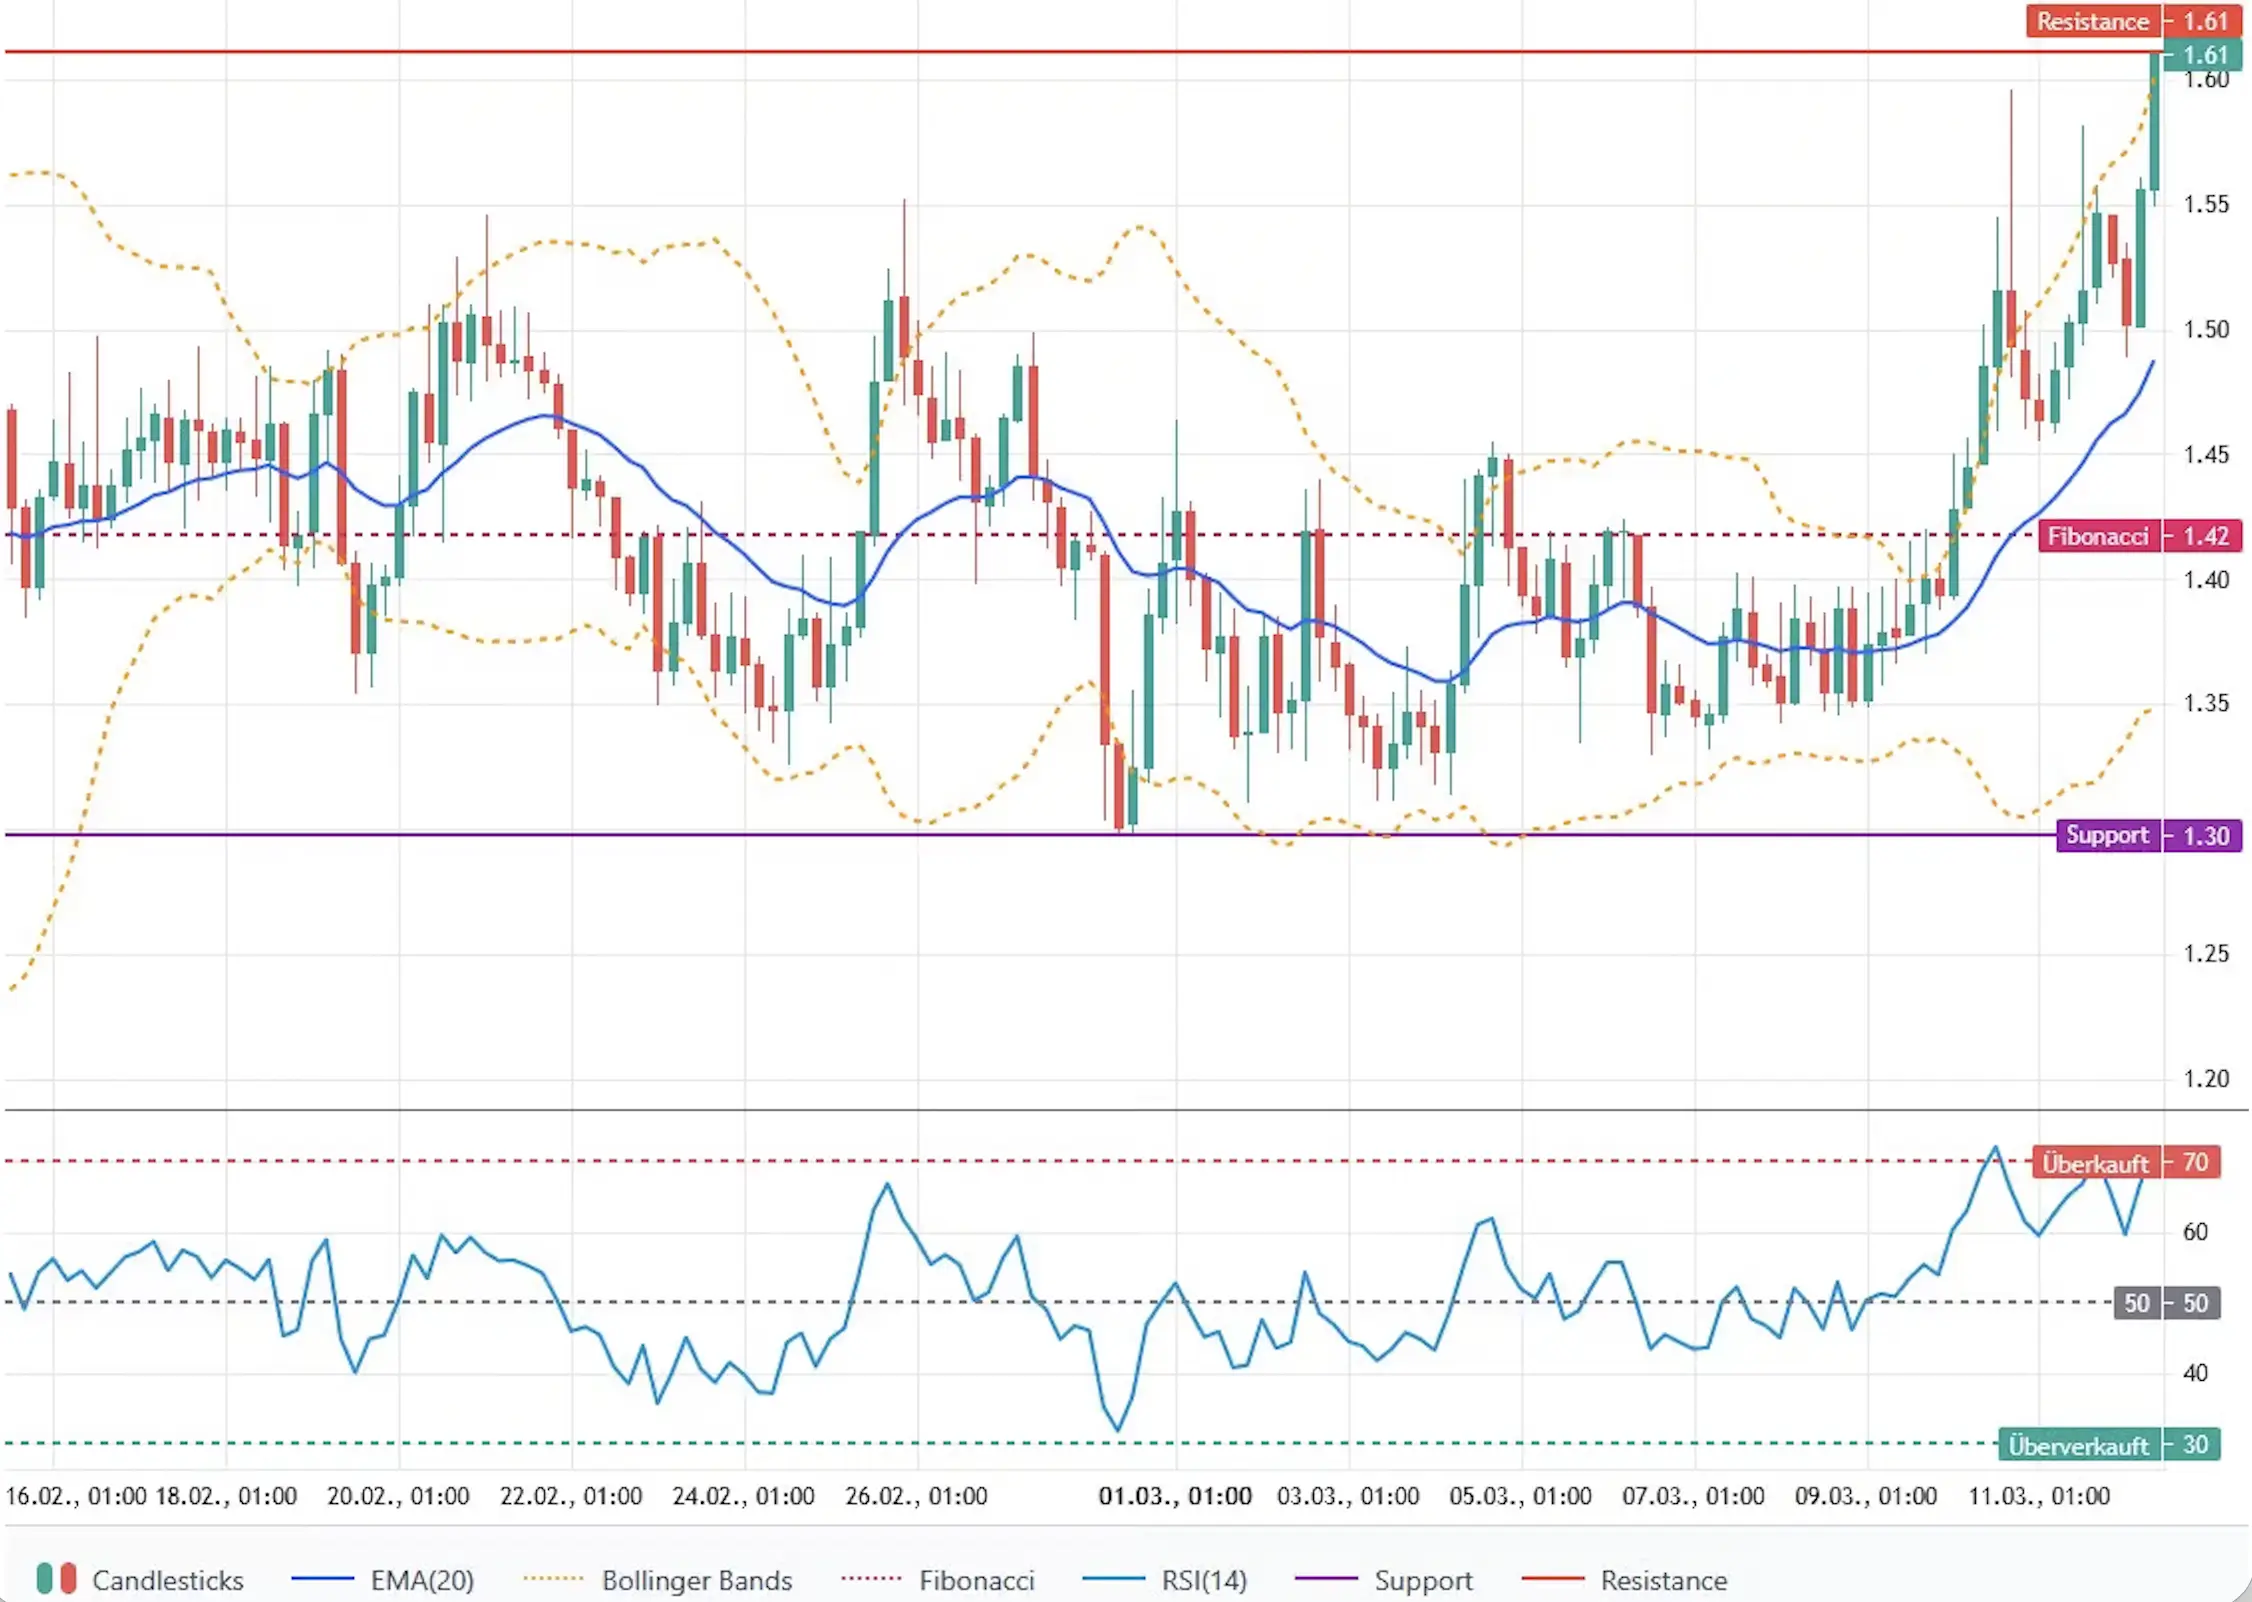
The nearest support levels are located at 1.556$ and 1.48763$ (EMA-20). Immediate resistance is positioned around 1.611$. As long as the price remains above the EMA-20, the short-term technical outlook remains bullish.
RSI and Bollinger Bands
The Relative Strength Index (RSI) currently stands at 72.34, indicating overbought conditions. At the same time, the histogram shows positive acceleration, confirming the current upward momentum.
The width of the Bollinger Bands is around 0.25$, suggesting elevated but still controlled volatility. Overall, Render appears to be in a short-term breakout phase within a broader upward movement.
Render Short-Term Outlook
The short-term outlook for Render as of March 12, 2026, remains bullish. Key support levels are located at 1.556$ and 1.48763$ (EMA-20).
On the upside, the nearest targets are 1.611$ and the zone around 1.70$.
If the price manages to secure a breakout above 1.611$ alongside rising trading volumes, the rally could extend toward 1.70–2.20$. However, if the price drops below 1.48763$, bearish scenarios may come back into focus. Given the rising volatility, investors should pay close attention to risk management.
