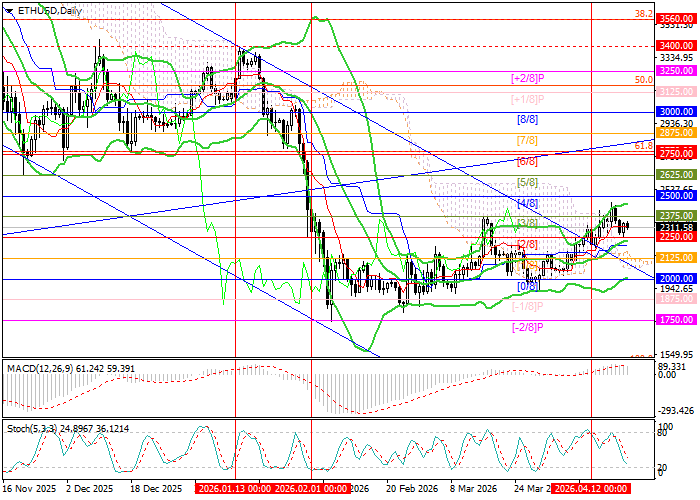
Last week, the ETH/USD pair attempted to move higher, trying to begin the formation of a new upward trend, and on Friday reached three-month highs around 2462.00. It then corrected toward the middle Bollinger Band amid ongoing uncertainty surrounding the second round of negotiations between the United States and Iran, which, according to CNN, is set to take place in Pakistan as early as tomorrow. Reports suggest that the US delegation will be led by Vice President J.D. Vance, while the Iranian side will be headed by Parliament Speaker Mohammad Bagher Ghalibaf. Meanwhile, if the price breaks below 2250.00 (Murray [6/8], middle Bollinger Band), the decline could resume toward 2000.00 (Murray [0/8], lower Bollinger Band) and 1750.00 (Murray [–2/8]). At the same time, the 2500.00 level (Murray [4/8], middle Bollinger Band, W1) remains the key threshold for bulls: a breakout above it could reverse the long-term downtrend and open the way toward 2812.50 (Murray [6/8], 61.8% Fibonacci retracement), 3125.00 (Murray [+1/8], 50.0% Fibonacci retracement), and 3400.00 (the area of the January highs).
Technical indicators still allow for a continuation of the upward move: Bollinger Bands are turning upward, Stochastic is moving downward but remains close to oversold territory, which is interpreted as a signal of a possible reversal soon, while the MACD histogram is expanding in positive territory. It is also worth noting that on the weekly chart, Bollinger Bands are still directed downward, indicating that the long-term bearish trend remains in place. However, the price is now close to the 2500.00 mark (middle Bollinger Band, W1), and a breakout above this level could trigger a broader trend reversal.
Support and resistance levels
Resistance levels: 2500.00, 2812.50, 3125.00, 3400.00.
Support levels: 2250.00, 2000.00, 1750.00.
Trading scenarios and ETH/USD forecast
Long positions may be opened above 2500.00 with targets at 2812.50, 3125.00, 3400.00 and a stop-loss at 2315.00. Timeframe for implementation: 5–7 days.
Short positions may be opened below 2250.00 with targets at 2000.00, 1750.00 and a stop-loss at 2440.00.
Scenario
| Timeframe |
Weekly |
| Recommendation |
BUY STOP |
| Entry Point |
2510.00 |
| Take Profit |
2812.50, 3125.00, 3400.00 |
| Stop Loss |
2315.00 |
| Key Levels |
1750.00, 2000.00, 2250.00, 2500.00, 2812.50, 3125.00, 3400.00 |
Alternative Scenario
| Recommendation |
SELL STOP |
| Entry Point |
2230.00 |
| Take Profit |
2000.00, 1750.00 |
| Stop Loss |
2440.00 |
| Key Levels |
1750.00, 2000.00, 2250.00, 2500.00, 2812.50, 3125.00, 3400.00 |
John Isige is an experienced cryptocurrency journalist and market analyst specializing in digital assets, blockchain innovation, and emerging Web3 trends. He provides clear, actionable market insights for traders and investors, with particular expertise in DeFi, smart contracts, NFTs, RWAs, and AI-powered blockchain ecosystems. His commentary and analysis have been featured in FORECK.INFO, CoinGape, CryptoNews, and other leading digital finance publications


