

On one hand, the diplomatic process has slowed: the second round of talks in Pakistan was canceled after the sides failed to reach a compromise. At the same time, Iran continues to block the Strait of Hormuz, while the United States maintains restrictions on the Islamic republic’s ports. The two sides continue to exchange air strikes and seize commercial vessels from time to time, keeping tensions elevated across the region. On the other hand, US President Donald Trump announced an extension of the ceasefire for an indefinite period, while open military action has not resumed, allowing traders to retain cautious optimism. Markets appear to be betting on stabilization at the current level, which would reduce the risk of further damage to Gulf oil infrastructure, higher energy prices, and a broader global slowdown.
At the moment, the crypto fear and greed index has climbed to a four-month high of 49, approaching the “greed” zone, while inflows into digital exchange-traded products continue to rise. Since the start of the week, inflows into Bitcoin ETFs have reached $676.0 million, Ethereum ETFs have attracted $207.6 million, and Solana ETFs have added $3.1 million. This suggests investors are increasingly ready to step back into crypto assets on any meaningful positive signal.
Demand for SOL itself is also rising as more products are launched on the Solana blockchain. One of the latest developments is the launch by OCBC Ltd., one of Singapore’s largest banking and financial groups, of the tokenized physical gold product LionGlobal Singapore Physical Gold Fund, whose underlying token, GOLDX, was created on both Solana and Ethereum. The token is designed for institutional investors, hedge funds, and asset-management firms, and can be purchased using both stablecoins and fiat currencies. In addition, GSR Markets Pte. Ltd. recently launched its first exchange-traded crypto fund, GSR Crypto Core3 (BESO), which tracks the prices of three major tokens at once — BTC, ETH, and SOL — while also offering staking rewards. On its first trading day, the product recorded nearly $5.0 million in volume. Analysts note that major firms such as Morgan Stanley and The Goldman Sachs Group Inc. are also signaling plans to launch their own ETFs, reinforcing the view that institutional interest in digital assets is continuing to build and increasing the likelihood of a broader recovery in the crypto sector.
Support and resistance levels
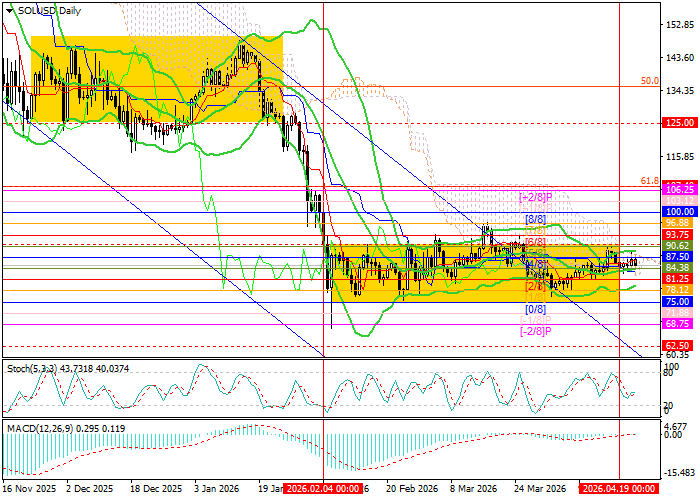
The instrument is moving within the sideways range of 91.00–75.00. If price breaks above 91.00, which it is currently approaching, growth may resume toward 100.00 (Murray level [8/8]), 107.40 (61.8% Fibonacci retracement), and 125.00 (Murray level [4/8], W1). If the price consolidates below 75.00 (Murray level [0/8]), a decline toward 68.75 (Murray level [–2/8]) and 62.50 (Murray level [2/8], W1) becomes more likely.
Technical indicators continue to allow for moderate upside: Bollinger Bands are turning upward, the MACD histogram has moved into positive territory while volumes remain limited, and Stochastic is trying to reverse higher.
Resistance levels: 91.00, 100.00, 107.40, 125.00.
Support levels: 75.00, 68.75, 62.50.
Trading scenarios and SOL/USD forecast
Long positions may be opened above 91.00 with targets at 100.00, 107.40, and 125.00, with a stop-loss at 84.50. Implementation period: 5–7 days.
Short positions may be opened below 75.00 with targets at 68.75 and 62.50, with a stop-loss at 80.00.
Scenario
| Timeframe | Weekly |
| Recommendation | BUY STOP |
| Entry Point | 91.40 |
| Take Profit | 100.00, 107.40, 125.00 |
| Stop Loss | 84.50 |
| Key levels | 62.50, 68.75, 75.00, 91.00, 100.00, 107.40, 125.00 |
Alternative Scenario
| Recommendation | SELL STOP |
| Entry Point | 74.70 |
| Take Profit | 68.75, 62.50 |
| Stop Loss | 80.00 |
| Key levels | 62.50, 68.75, 75.00, 91.00, 100.00, 107.40, 125.00 |
