

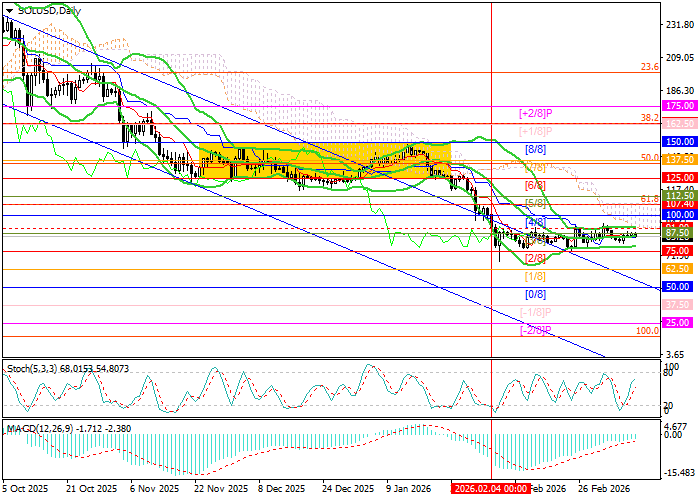
The key resistance zone for bulls remains at 107.40–112.50 (Fibonacci 61.8% retracement, Murray level [4/8]). A confirmed breakout above this area could trigger upward momentum toward 150.00 (Murray level [8/8]) and 162.50 (Murray level [+1/8], Fibonacci 38.2% retracement). On the other hand, a downside breakout below 75.00 (Murray level [2/8], lower Bollinger Band) would likely strengthen bearish momentum, opening the way for declines toward 50.00 (Murray level [0/8]) and 25.00 (Murray level [–1/8]).
Technical indicators do not provide a unified signal, reflecting ongoing market uncertainty. Bollinger Bands remain horizontal, the Stochastic oscillator is moving upward but is approaching the overbought zone, which may signal a potential reversal, while the MACD histogram remains stable in the negative zone.
In the short term, the instrument may continue to trade within the 91.00–75.00 channel. However, on the weekly chart Bollinger Bands are pointing downward and the MACD histogram is expanding in negative territory, confirming the high probability of a bearish trend. In addition, the price chart shows signs of forming a “flag” pattern.
Support and resistance levels
Resistance levels: 112.50, 150.00, 162.50.
Support levels: 75.00, 50.00, 25.00.
Trading scenarios and SOL/USD forecast
Short positions may be opened below the 75.00 level with targets at 50.00 and 25.00 and a stop-loss at 90.00. Implementation period: 5–7 days.
Long positions may be opened above the 112.50 level with targets at 150.00 and 162.50 and a stop-loss at 90.90.
Scenario
| Timeframe | Weekly |
| Recommendation | SELL STOP |
| Entry Point | 74.10 |
| Take Profit | 50.00, 25.00 |
| Stop Loss | 90.00 |
| Key levels | 25.00, 50.00, 75.00, 112.50, 150.00, 162.50 |
Alternative scenario
| Recommendation | BUY STOP |
| Entry Point | 112.60 |
| Take Profit | 150.00, 162.50 |
| Stop Loss | 90.90 |
| Key levels | 25.00, 50.00, 75.00, 112.50, 150.00, 162.50 |
