

Technical indicators are sending mixed signals. Bollinger Bands are turning upward, and the MACD histogram has moved into positive territory, but Stochastic has reached the overbought zone, which does not rule out a near-term downside reversal. At the same time, on the weekly chart, Bollinger Bands are still directed downward, while the MACD histogram continues to expand in negative territory, confirming that the broader bearish trend remains in place. At the same time, the chart is showing signs of a developing flag pattern, which could allow the asset to rise toward 125.00 (the middle Bollinger Band on W1).
Support and resistance levels
Resistance levels: 100.00, 125.00, 137.50.
Support levels: 91.00, 75.00, 62.50, 50.00.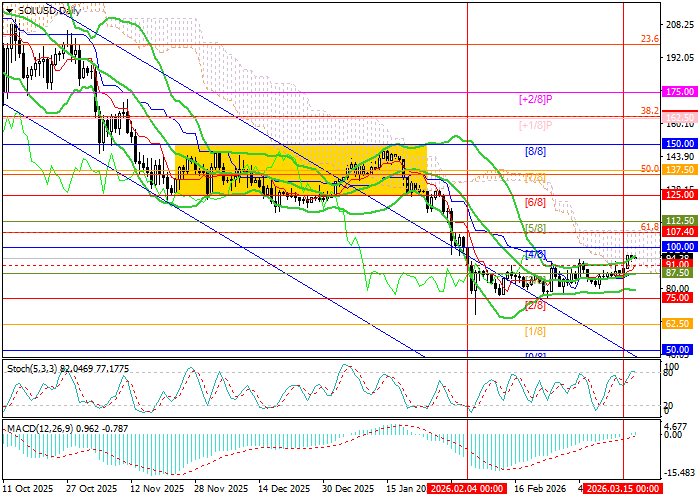
Trading scenarios and SOL/USD forecast
Long positions may be opened above 100.00 with targets at 125.00 and 137.50, with a stop-loss at 91.00. Implementation period: 5–7 days.
Short positions may be opened from 87.50 with targets at 75.00, 62.50, and 50.00, with a stop-loss at 98.00.
Scenario
| Timeframe | Weekly |
| Recommendation | BUY STOP |
| Entry point | 101.00 |
| Take Profit | 125.00, 137.50 |
| Stop Loss | 91.00 |
| Key levels | 50.00, 62.50, 75.00, 91.00, 100.00, 125.00, 137.50 |
Alternative scenario
| Recommendation | SELL STOP |
| Entry point | 87.50 |
| Take Profit | 75.00, 62.50, 50.00 |
| Stop Loss | 98.00 |
| Key levels | 50.00, 62.50, 75.00, 91.00, 100.00, 125.00, 137.50 |
