

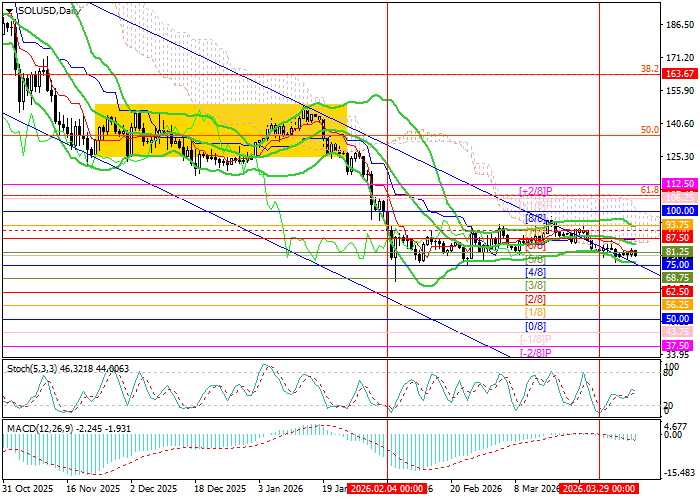
The key level for the bulls remains 100.00 (Murray level [4/8]), a breakout of which would signal a reversal of the long-term trend and strengthen upward momentum toward the targets of 125.00 (Murray level [6/8]) and 137.50 (Murray level [7/8], 50.0% Fibonacci retracement). Nevertheless, if the price breaks below the lower boundary of the sideways range at 75.00 (Murray level [2/8]), which it is currently approaching, sellers may seize the initiative and consolidate near 62.50 (Murray level [1/8]) and 50.00 (Murray level [0/8]).
Technical indicators do not provide a unified signal: Bollinger Bands are turning downward, while the MACD histogram remains in negative territory, allowing for the formation of a new short-term trend. At the same time, Stochastic is moving upward, not ruling out a correction. It is also worth noting that signs of a flag pattern are visible on the weekly chart, confirming the relevance of the bearish scenario in the medium term.
Support and resistance levels
Resistance levels: 100.00, 125.00, 137.50.
Support levels: 75.00, 62.50, 50.00.
Trading scenarios and SOL/USD forecast
Short positions may be opened below the level of 75.00 with targets at 62.50 and 50.00, and a stop-loss at 84.50. Expected implementation period: 5-7 days.
Long positions may be opened above the level of 100.00 with targets at 125.00 and 137.50, and a stop-loss at 91.00.
Scenario
| Timeframe | Weekly |
| Recommendation | SELL STOP |
| Entry Point | 74.20 |
| Take Profit | 62.50, 50.00 |
| Stop Loss | 84.50 |
| Key Levels | 50.00, 62.50, 75.00, 100.00, 125.00, 137.50 |
Alternative Scenario
| Recommendation | BUY STOP |
| Entry Point | 100.00 |
| Take Profit | 125.00, 137.50 |
| Stop Loss | 91.00 |
| Key Levels | 50.00, 62.50, 75.00, 100.00, 125.00, 137.50 |
