

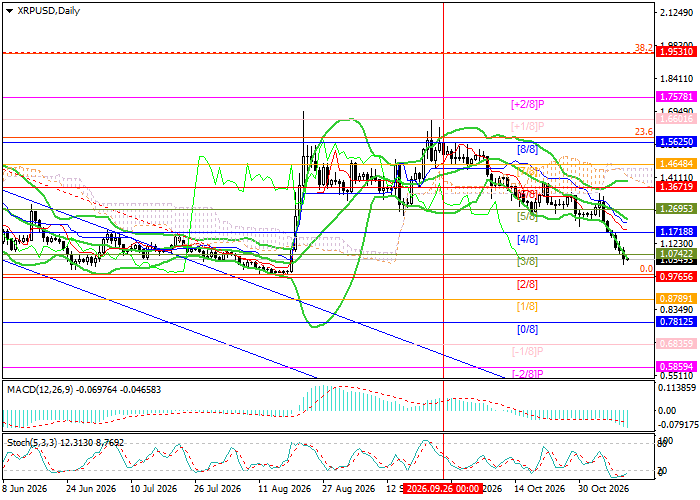
A sustained break below the range floor at 0.9765 (Murrey Math [2/8]) could expose 0.7812 ([0/8]) and 0.5859 ([–2/8]). A sustained move above the middle Bollinger Band at 1.2695 (Murrey Math [5/8]) could open the way toward 1.5625 ([8/8]), 1.7578 ([+2/8]) and 1.9531. The 1.2695 level was identified as a downside target in our October 14 XRP/USD analysis.
Technical indicators retain a sell signal. The Bollinger Bands are turning lower, and the negative MACD histogram bars are expanding. The Stochastic oscillator may exit oversold territory, leaving room for a limited rebound.
Support and resistance levels
Resistance levels are 1.2695, 1.5625, 1.7578 and 1.9531.
Support levels are 0.9765, 0.7812 and 0.5859.
Trading scenarios and XRP/USD forecast
The short scenario uses an entry below 0.9765, with targets at 0.7812 and 0.5859 and a stop loss at 1.1000. The estimated time horizon is 5–7 days.
The long scenario uses an entry above 1.2695, with targets at 1.5625, 1.7578 and 1.9531 and a stop loss at 1.1350.
Scenario
| Timeframe | Weekly |
| Recommendation | SELL STOP |
| Entry point | 0.9765 |
| Take Profit | 0.7812, 0.5859 |
| Stop Loss | 1.1000 |
| Key levels | 0.5859, 0.7812, 0.9765, 1.2695, 1.5625, 1.7578, 1.9531 |
Alternative scenario
| Recommendation | BUY STOP |
| Entry point | 1.2695 |
| Take Profit | 1.5625, 1.7578, 1.9531 |
| Stop Loss | 1.1350 |
| Key levels | 0.5859, 0.7812, 0.9765, 1.2695, 1.5625, 1.7578, 1.9531 |
