

On the daily chart, the price remains above the resistance line of a descending channel with dynamic boundaries at 680.00–530.00.
On the four-hour chart, the stock has not yet overcome the previous high near 770.00. After closing the price gap at 715.10–736.12, the shares are correcting within a local upward wave. If the price reverses and consolidates below 715.00, the negative dynamics could develop into a full-scale downward correction toward 660.00. However, a continuation of the upward movement remains the more likely scenario.
Technical indicators maintain a stable buy signal: the fast EMAs of the Alligator indicator remain slightly above the slow ones, while the Awesome Oscillator (AO) histogram is forming corrective bars in positive territory.
As discussed in our previous Meta Platforms stock forecast, the company's expansion in artificial intelligence and data centre infrastructure remains an important factor for its longer-term outlook, although short-term price movements continue to depend on market sentiment and technical resistance levels.
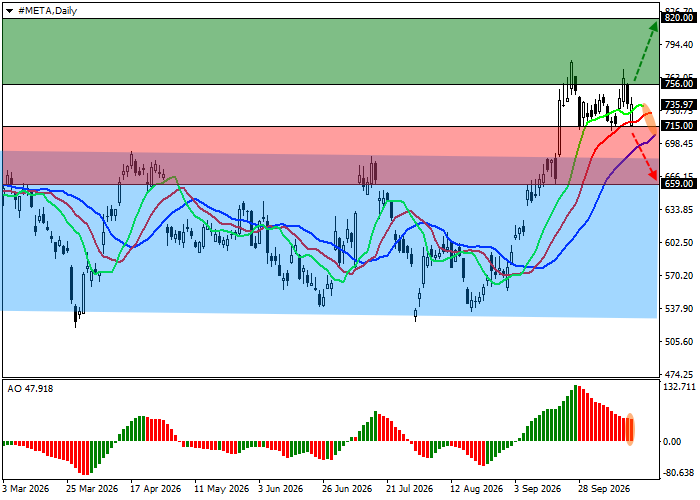
Meta Platforms stock trading scenarios and price forecast
Long positions may be opened after the price rises and consolidates above 756.00, with a target at 820.00. Stop-loss — 720.00. Estimated implementation period: 7 days or more.
Short positions may be opened after the price declines and consolidates below 715.00, with a target at 659.00. Stop-loss — 735.00.
Scenario
| Timeframe | Weekly |
| Recommendation | BUY STOP |
| Entry point | 756.00 |
| Take Profit | 820.00 |
| Stop Loss | 720.00 |
| Key levels | 659.00, 715.00, 756.00, 820.00 |
Alternative scenario
| Recommendation | SELL STOP |
| Entry point | 715.00 |
| Take Profit | 659.00 |
| Stop Loss | 735.00 |
| Key levels | 659.00, 715.00, 756.00, 820.00 |
