

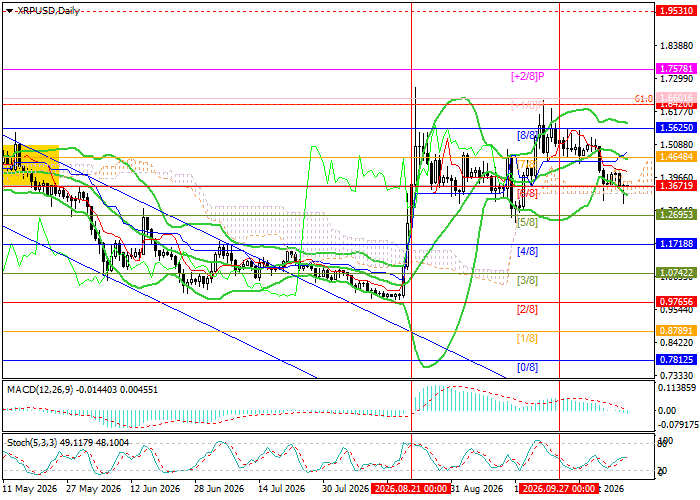
Technical indicators do not provide a unified signal: Bollinger Bands are turning down, Stochastic is moving up from the oversold area, and the MACD histogram remains stable in the negative zone. On the weekly chart, Bollinger Bands are attempting to form an upward trend after a multi-month decline. Under these conditions, the asset may continue to fall in the short term, but in the medium term, price growth appears more likely.
Support and resistance levels
Resistance levels: 1.4648, 1.6420, 1.7578, 1.9531.
Support levels: 1.3671, 1.2695, 1.1718.
Trading scenarios and XRP/USD forecast
Long positions may be opened above the level of 1.4648 or after a price reversal near 1.2695, with targets at 1.6420, 1.7578 and 1.9531, and stop-loss orders at 1.3670 and 1.1718, respectively. Timeframe: 5–7 days.
Scenario
| Timeframe | Weekly |
| Recommendation | BUY STOP |
| Entry point | 1.4648 |
| Take Profit | 1.6420, 1.7578, 1.9531 |
| Stop Loss | 1.3670 |
| Key levels | 1.1718, 1.2695, 1.3671, 1.4648, 1.6420, 1.7578, 1.9531 |
Alternative scenario
| Recommendation | BUY LIMIT |
| Entry point | 1.2695 |
| Take Profit | 1.6420, 1.7578, 1.9531 |
| Stop Loss | 1.1718 |
| Key levels | 1.1718, 1.2695, 1.3671, 1.4648, 1.6420, 1.7578, 1.9531 |
