

Technical indicators maintain a buy signal: the Bollinger Bands and Stochastic oscillator are turning upward, while the MACD histogram remains stable in positive territory. On the weekly chart, the price reversed near the lower boundary of the long-term ascending channel and continues to form an upward trend.
As discussed in our previous ETH/USD forecast, Ethereum had already begun reversing its long-term downtrend after breaking above the 2000.00 area.
Support and resistance levels
Resistance levels: 2812.50, 3165.00, 3400.00.
Support levels: 2500.00, 2187.50, 1875.00.
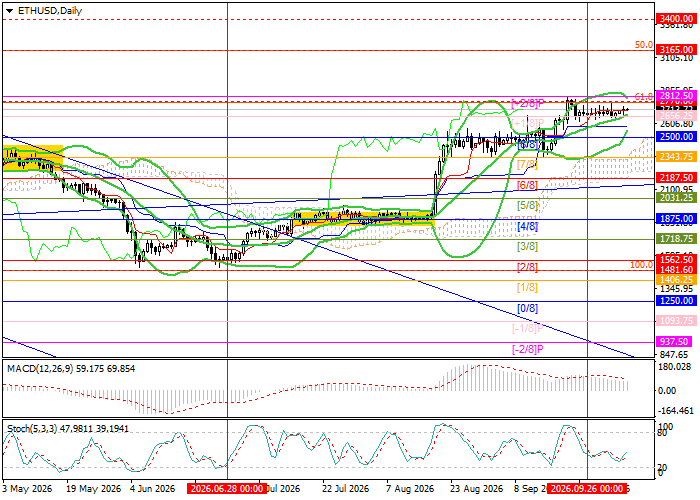
ETH/USD trading scenarios and price forecast
Long positions may be opened above 2812.50 with targets at 3165.00 and 3400.00 and a stop-loss at 2600.00. Estimated implementation period: 5–7 days. Short positions may be opened below 2500.00 with targets at 2187.50 and 1875.00 and a stop-loss at 2690.00.
Scenario
| Timeframe | Weekly |
| Recommendation | BUY STOP |
| Entry point | 2812.50 |
| Take Profit | 3165.00, 3400.00 |
| Stop Loss | 2600.00 |
| Key levels | 1875.00, 2187.50, 2500.00, 2812.50, 3165.00, 3400.00 |
Alternative scenario
| Recommendation | SELL STOP |
| Entry point | 2500.00 |
| Take Profit | 2187.50, 1875.00 |
| Stop Loss | 2690.00 |
| Key levels | 1875.00, 2187.50, 2500.00, 2812.50, 3165.00, 3400.00 |
