

Analysts believe the current rally is being driven by investor hopes for an easing of geopolitical tensions in the Middle East. Earlier, U.S. President Donald Trump said that diplomatic consultations with Iran were underway, although official Tehran denied that any talks were taking place. Meanwhile, Foreign Minister Abbas Araghchi stated that the Strait of Hormuz is not closed to all vessels, but only to those linked to the Islamic Republic’s adversaries. Media reports had previously suggested that agreements had already been reached allowing Chinese and Indian tankers to pass freely through the waterway, which could reduce the risk of supply shortages in the oil market and ease trader concerns.
Even so, analysts warn that the upward move in prices does not yet confirm the formation of a reliable new trend. They note that a similar situation occurred in early January, when the coin gained 8.0%, but the bullish momentum lasted only two weeks before selling resumed. The same pattern could repeat under the influence of monetary factors if the U.S. Federal Reserve, following Wednesday’s meeting at 20:00 (GMT+2), signals that interest rates will remain high for longer or even hints at another increase. That scenario appears plausible given that inflation remains above the regulator’s 2.0% target, with February consumer inflation at 2.4% and the core reading at 2.5% year-on-year, while there are also signs of labor market cooling, as unemployment rose from 4.3% to 4.4% and nonfarm payrolls came in at –92.0 thousand instead of the expected 58.0 thousand. Traditionally, officials tend to see inflation as the more important problem, and if fresh signals emerge in favor of maintaining the current monetary stance, the dollar could strengthen significantly against alternative assets, including digital ones.
Overall, sentiment in the cryptocurrency market is gradually beginning to improve. Last week, the balance of Bitcoin ETFs increased by 763.4 million dollars, while the Fear and Greed Index, although still remaining in the “extreme fear” zone, rose to 23, its highest level since January.
Support and resistance levels
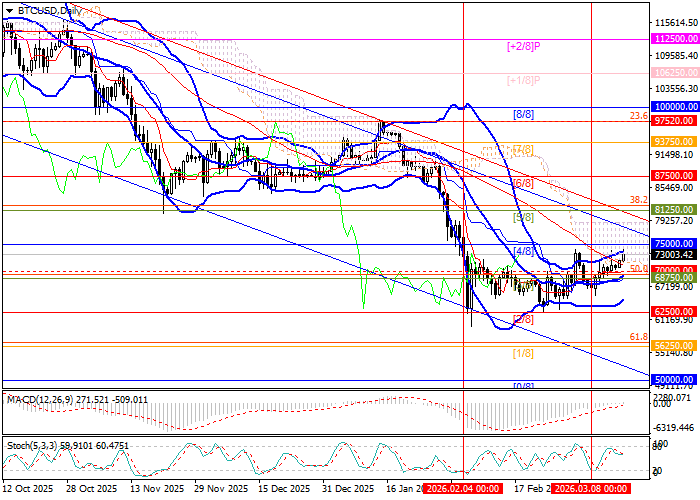
The asset has left the medium-term sideways range of 70000.00–62500.00, moved above the 50-day moving average, and is now approaching 75000.00, which corresponds to the Murray level [4/8]. If the price consolidates above this mark, it will break out of the descending channel and continue rising toward 81250.00, the Murray level [5/8] and the 38.2% Fibonacci retracement, and then toward 87500.00, the Murray level [6/8]. If the price reverses and breaks back below the middle Bollinger Band at 68750.00, which also aligns with the Murray level [3/8] and the 50.0% Fibonacci retracement, the decline may resume toward 62500.00, the Murray level [2/8], then 56250.00, the Murray level [1/8] and the 61.8% Fibonacci retracement, and finally 50000.00, the Murray level [0/8].
Technical indicators are sending mixed signals. Bollinger Bands are turning upward, the MACD histogram remains near the zero line with low volume, and Stochastic is beginning to move lower from overbought territory. It is also worth noting that the weekly chart shows signs of a developing flag pattern, while Bollinger Bands on that timeframe continue to decline, confirming that the broader negative trend may still be intact.
Resistance levels: 75000.00, 81250.00, 87500.00.
Support levels: 68750.00, 62500.00, 56250.00, 50000.00.
Trading scenarios and BTC/USD forecast
Long positions may be considered above 75000.00 with targets at 81250.00 and 87500.00 and a stop-loss at 71000.00. Timeframe: 5–7 days.
Short positions may be considered below 68750.00 with targets at 62500.00, 56250.00, and 50000.00 and a stop-loss at 73700.00.
Scenario
| Timeframe | Weekly |
| Recommendation | BUY STOP |
| Entry point | 75000.05 |
| Take Profit | 81250.00, 87500.00 |
| Stop Loss | 71000.00 |
| Key levels | 50000.00, 56250.00, 62500.00, 68750.00, 75000.00, 81250.00, 87500.00 |
Alternative scenario
| Recommendation | SELL STOP |
| Entry point | 68749.95 |
| Take Profit | 62500.00, 56250.00, 50000.00 |
| Stop Loss | 73700.00 |
| Key levels | 50000.00, 56250.00, 62500.00, 68750.00, 75000.00, 81250.00, 87500.00 |
