

Recent data confirmed a significant slowdown in US inflation. The annual consumer price index fell from 4.2% to 3.5%, compared with the 3.8% forecast, while the core measure declined from 2.9% to 2.6%, below expectations of 2.8%. Producer price inflation slowed from 6.0% to 5.5% overall. Although the core indicator increased from 4.6% to 4.7%, it remained well below the projected 5.2%. As a result, the immediate need for the US Federal Reserve to tighten credit conditions has diminished considerably, supporting assets that compete with the Dollar. Nevertheless, analysts are concerned that higher oil prices caused by escalating geopolitical tensions in the Persian Gulf could reignite inflation and force the regulator to return to a more hawkish stance, limiting the upside potential of cryptocurrencies.
Digital assets are also under pressure from delays in adopting the rules and legislation intended to regulate the industry. Last week, the deadline expired for completing the implementing regulations under the Guiding and Establishing National Innovation for US Stablecoins Act, known as the GENIUS Act. Draft rules have already been published but have not yet progressed to the final stage, creating continued uncertainty around the use of stablecoins. In addition, the Digital Asset Market Clarity Act, or CLARITY Act, may fail to secure Senate approval because it does not include so-called ethics provisions preventing serving politicians from profiting from cryptocurrency trading. Sentiment was further affected by the publication of President Donald Trump’s financial disclosure, which stated that he earned $1.4 billion from the Official Trump memecoin and other digital assets in 2025. Commenting on the report, Democratic Senator Elizabeth Warren said that without appropriate safeguards in the CLARITY Act, conflicts of interest within the administration would remain and that the bill should be amended accordingly.
Overall, despite price stabilisation, market sentiment remains negative, as reflected by the Fear and Greed Index staying in the “fear” zone at 29. Nevertheless, spot Bitcoin ETFs recorded net inflows of $75.4 million last week, returning to positive territory.
Support and Resistance Levels
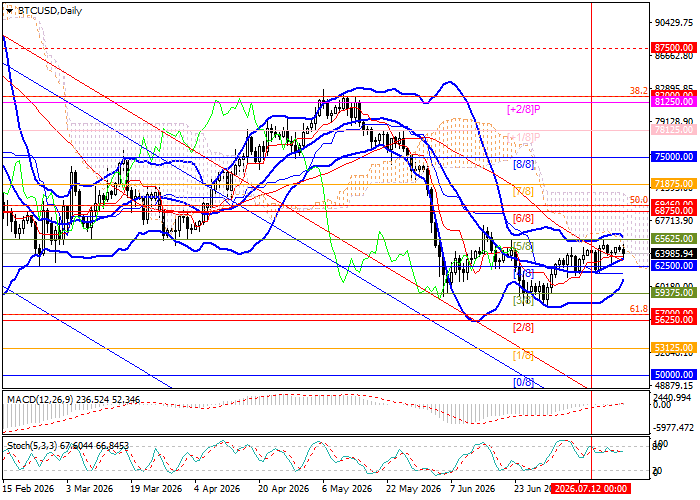
The trading instrument is attempting to form a new upward trend. A breakout above 65,625.00, corresponding to Murray level [5/8], could extend the advance towards 69,460.00, the 50.0% Fibonacci retracement, and 75,000.00, Murray level [8/8]. However, a break below the middle line of the Bollinger Bands at 62,500.00, Murray level [4/8], could trigger a decline towards 57,000.00, the 61.8% Fibonacci retracement, and 50,000.00, Murray level [0/8].
Technical indicators provide mixed signals. The Bollinger Bands are turning upwards, the MACD histogram remains near the zero line with limited momentum, while the Stochastic Oscillator is moving horizontally near the overbought zone.
Resistance levels: 65,625.00, 69,460.00, 75,000.00.
Support levels: 62,500.00, 57,000.00, 50,000.00.
BTC/USD Trading Scenarios and Forecast
Short positions may be opened below 62,500.00, with targets at 57,000.00 and 50,000.00 and a stop-loss at 65,000.00. Estimated timeframe: five to seven days.
Long positions may be opened above 65,625.00, with targets at 69,460.00 and 75,000.00 and a stop-loss at 63,000.00.
Scenario
| Timeframe | Weekly |
| Recommendation | SELL STOP |
| Entry Point | 62,470.00 |
| Take Profit | 57,000.00, 50,000.00 |
| Stop Loss | 65,000.00 |
| Key Levels | 50,000.00, 57,000.00, 62,500.00, 65,625.00, 69,460.00, 75,000.00 |
Alternative Scenario
| Recommendation | BUY STOP |
| Entry Point | 65,650.00 |
| Take Profit | 69,460.00, 75,000.00 |
| Stop Loss | 63,000.00 |
| Key Levels | 50,000.00, 57,000.00, 62,500.00, 65,625.00, 69,460.00, 75,000.00 |
