
Top Pick

- Fully licensed and regulated US exchange
- Strong focus on security and compliance
- User-friendly interface for beginners

The cryptocurrency market strengthened earlier this week but came under sharp selling pressure on Thursday, erasing much of its previous gains. In the latest market snapshot, Bitcoin (BTC) is trading near 81600.00 (+0.9%), Ethereum (ETH) at 2400.00 (+2.1%), Tether (USDT) at 0.9991 (–0.01%), BNB at 744.00 (+5.1%) and XRP at 1.3250 (+4.8%). Total cryptocurrency market capitalization has declined to approximately $2.73 trillion, while Bitcoin dominance has increased to 60.0%. From October 19 to 22, US spot Bitcoin ETFs recorded net inflows of $439.1 million, while Ethereum ETFs saw outflows of $225.1 million. The market remains volatile despite the recovery attempt discussed in our previous crypto weekly review.

 By John Isige
 The Ethereum price recently managed to rise above the $2,100 level, injecting new momentum into the market. However, the rally proved short-lived. Data currently points to a mixed picture, with signs of both selling pressure and accumulation by investors.

 By Andrew Bennett
 U.S. exchange operator Nasdaq and Börse Stuttgart Group have announced a partnership to expand trading in tokenized assets across Europe. The plan is to connect trading venues through a unified blockchain infrastructure.
 By John Isige
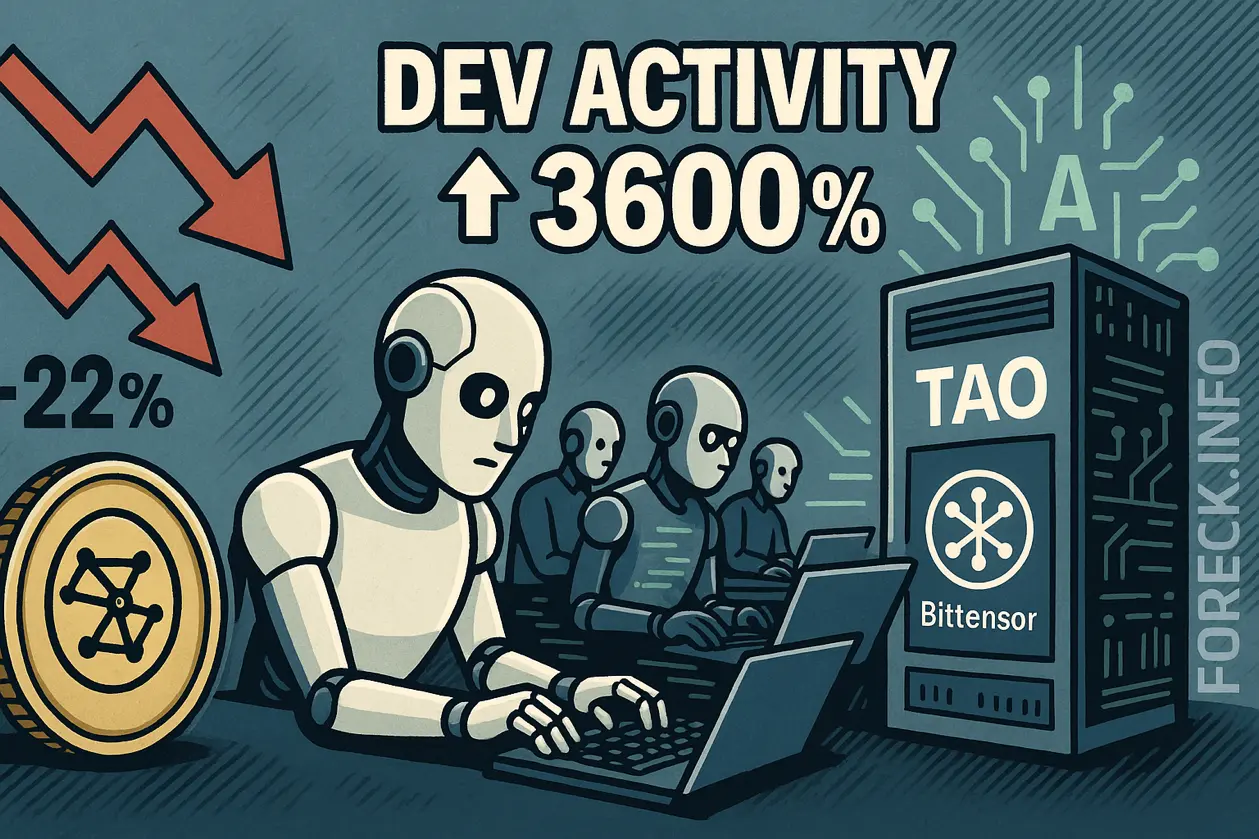
 Bittensor continues to show strong momentum in the cryptocurrency market and is gradually approaching the psychological $200 level. Over the past 24 hours, the AI token TAO has gained about 10%, extending its recent recovery phase.
 By John Isige
 Last week, the BTC/USD pair attempted to move higher, reaching two-month highs near 73,975.00. However, as analysts had anticipated, the rally lacked strong fundamental support, and the price returned to the medium-term sideways range of 70,000.00–62,500.00, currently trading around 67,000.00.
 By John Isige
 The cryptocurrency market is starting the new week with moderate price gains. Bitcoin is trading around $67,000, rising by about 0.3%, while Ethereum is up roughly 2%, gradually approaching the $2,000 level. Similar modest movements are visible across the broader crypto market.
 By John Isige
 The cryptocurrency market has once again come under pressure, and the latest sell-off has hit Solana particularly hard. However, despite the price decline, interest from institutional investors remains strong.
 By Andrew Bennett
 Cardano has recently strengthened noticeably and is benefiting from improved sentiment in the cryptocurrency market. However, data also shows rising selling pressure from large investors and increased activity among older coins.
 By John Isige
 This week the cryptocurrency market attempted to rebound, but prices are currently declining again. Bitcoin (BTC) is trading around $71,000 (+8.1%), Ethereum (ETH) near $2,080 (+7.8%), while the stablecoin USDT is hovering around $0.9999 (–0.02%). BNB, which returned to the fourth position by market capitalization this week, is trading near $645 (+5.4%), and XRP is at $1.4165 (+3.8%). Total market capitalization stands at $2.40 trillion, with Bitcoin dominance reaching 59.1%. Meanwhile, Bitcoin ETF balances increased by $917.4 million and Ethereum ETF balances by $106.4 million.
 By Andrew Bennett
 Bitcoin failed to hold above the $74,000 level and has fallen back toward the $70,000 area. Market attention is now shifting to new macroeconomic data from the United States. After a short-term rally above $74,000, the largest cryptocurrency quickly corrected, losing more than $3,000 within a short period. At the time of publication, BTC is trading near $70,500.
 By John Isige
 The SOL/USD pair has been trading within a sideways range of 91.00–75.00 (upper and lower Bollinger Bands) for the second consecutive month and is currently approaching the upper boundary of this corridor. At the same time, analysts remain divided regarding the future direction of the market. Many experts believe that the overall weakness of the cryptocurrency market has likely reached its bottom and that a recovery could begin soon. However, some specialists remain skeptical, warning that the recent rally may represent a “bull trap,” similar to the situation in January when prices briefly moved higher before sharply correcting downward.
By John Isige The Solana price is showing relative resilience. Network activity is increasing — raising the question of whether the asset is preparing for its next major move. Geopolitical tensions in the Middle East have put pressure on the entire cryptocurrency market, and the SOL price has also been affected by this uncertainty. At the same time, Solana remains well below the psychologically important $100 level. Nevertheless, the asset demonstrated notable stability over the past week.
 By John Isige
 The XRP/USD pair remains within a long-term downward trend, forming a corresponding channel. However, at the end of last month the price stabilized within a narrow sideways range of 1.4400–1.3350 and has not yet managed to break out, awaiting new market catalysts. The key level for bears is seen at 1.1718 (Murray level [2/8]), which the price unsuccessfully tested last month. A breakout below this level would signal a resumption of the downward movement toward 0.7812 (Murray level [0/8]) and 0.5859 (Murray level [–1/8]).


For crypto, the framework is similar to traditional financial markets but comes with its own twist. Here, price action turns on liquidity, adoption, regulation, and flows from institutions alongside retail sentiment. Network health—hash rate, staking, active wallets—adds another layer. Macro still matters too: rates, dollar strength, and risk appetite shape inflows and outflows. Then, as with any market, you use the chart—trend, support and resistance, momentum, and volume—to spot setups and manage risk.