
Top Pick

- Fully licensed and regulated US exchange
- Strong focus on security and compliance
- User-friendly interface for beginners

The cryptocurrency market strengthened earlier this week but came under sharp selling pressure on Thursday, erasing much of its previous gains. In the latest market snapshot, Bitcoin (BTC) is trading near 81600.00 (+0.9%), Ethereum (ETH) at 2400.00 (+2.1%), Tether (USDT) at 0.9991 (–0.01%), BNB at 744.00 (+5.1%) and XRP at 1.3250 (+4.8%). Total cryptocurrency market capitalization has declined to approximately $2.73 trillion, while Bitcoin dominance has increased to 60.0%. From October 19 to 22, US spot Bitcoin ETFs recorded net inflows of $439.1 million, while Ethereum ETFs saw outflows of $225.1 million. The market remains volatile despite the recovery attempt discussed in our previous crypto weekly review.

 By Andrew Bennett
 Bitcoin remains relatively stable despite rising geopolitical tension tied to the conflict between the United States and Iran. The question now is whether the market is preparing for its next major move.
 By John Isige
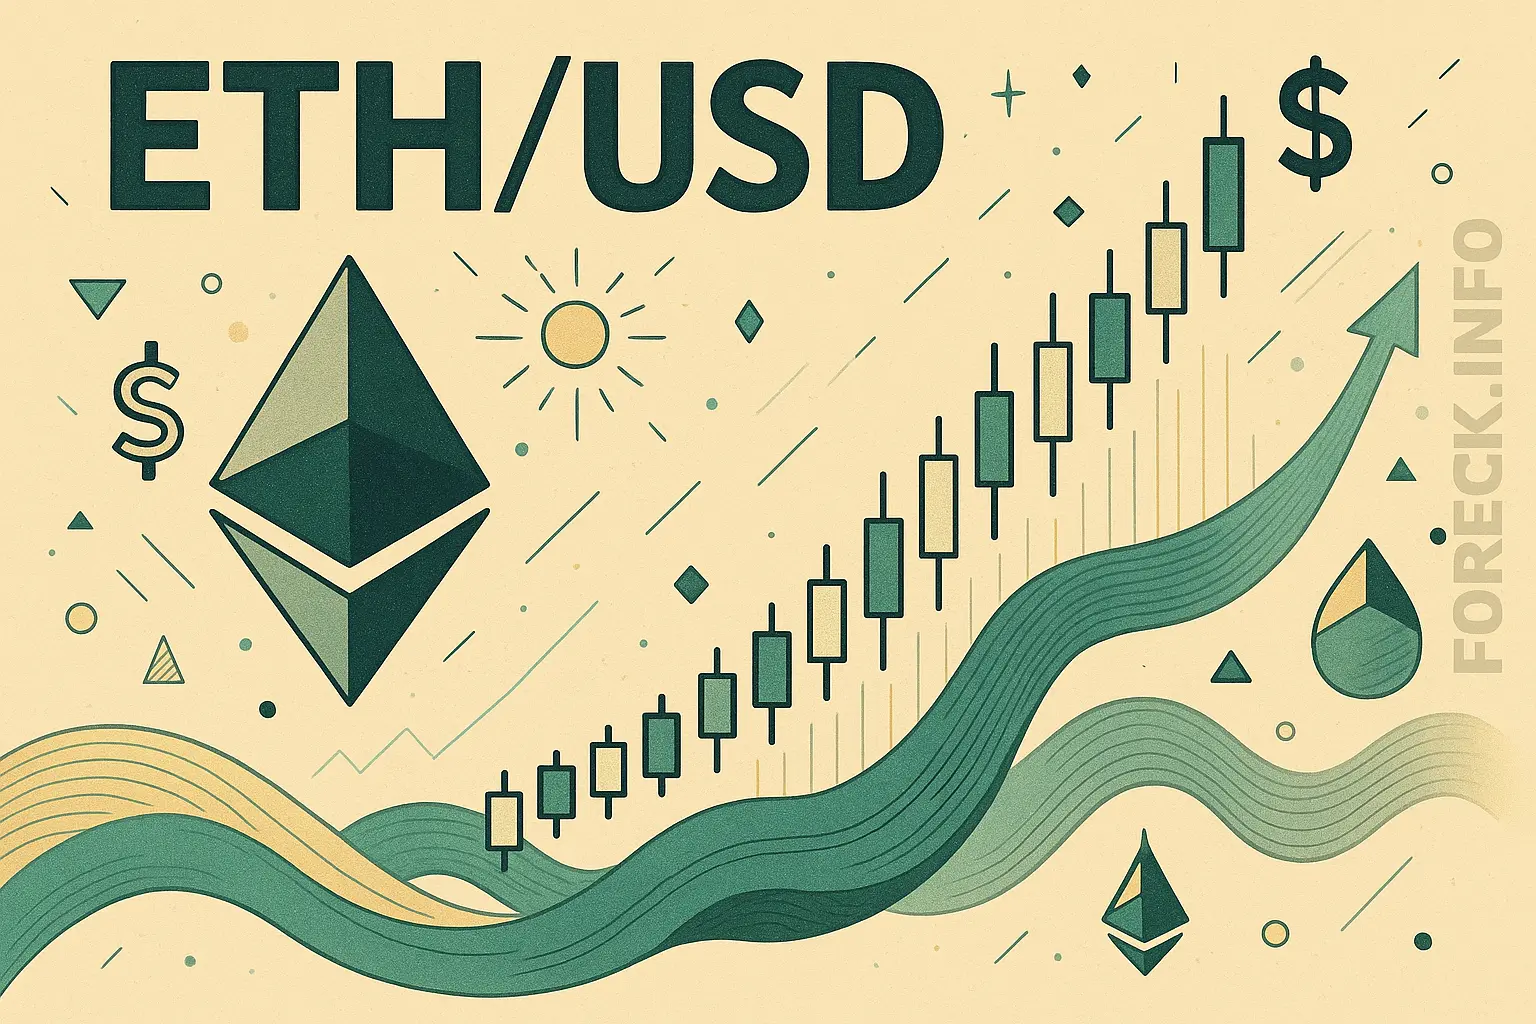
 Since early February, the ETH/USD pair has been moving within a broad sideways range of 2187.50–1875.00 (Murray [3/8]–[2/8]) and has so far failed to break out. A move beyond either boundary is expected to trigger the next major price swing. If the price consolidates above 2187.50 (Murray [3/8]), upside targets will come into focus at 2500.00 (Murray [4/8]), 2812.50 (Murray [5/8], Fibonacci retracement 61.8%), and 3125.00 (Murray [6/8], Fibonacci retracement 50.0%). If 1875.00 (Murray [2/8]) is broken to the downside, the asset may resume its decline toward 1481.50 (Fibonacci retracement 100.0%) and 1250.00 (Murray [0/8]).
 By John Isige
 In March 2026, a significantly larger volume of tokens was scheduled to become unlocked than in previous months. According to CryptoRank data available on March 2, the value of the month’s planned releases was estimated at approximately $5.8 billion, or nearly $6 billion.
 By John Isige
 Last week, the BTC/USD pair traded within the main sideways range of 70,000.00–62,500.00 (the upper Bollinger Band line — Murray level [2/8]), but it is currently under pressure amid a sharp deterioration in the geopolitical situation in the Middle East.
 By John Isige
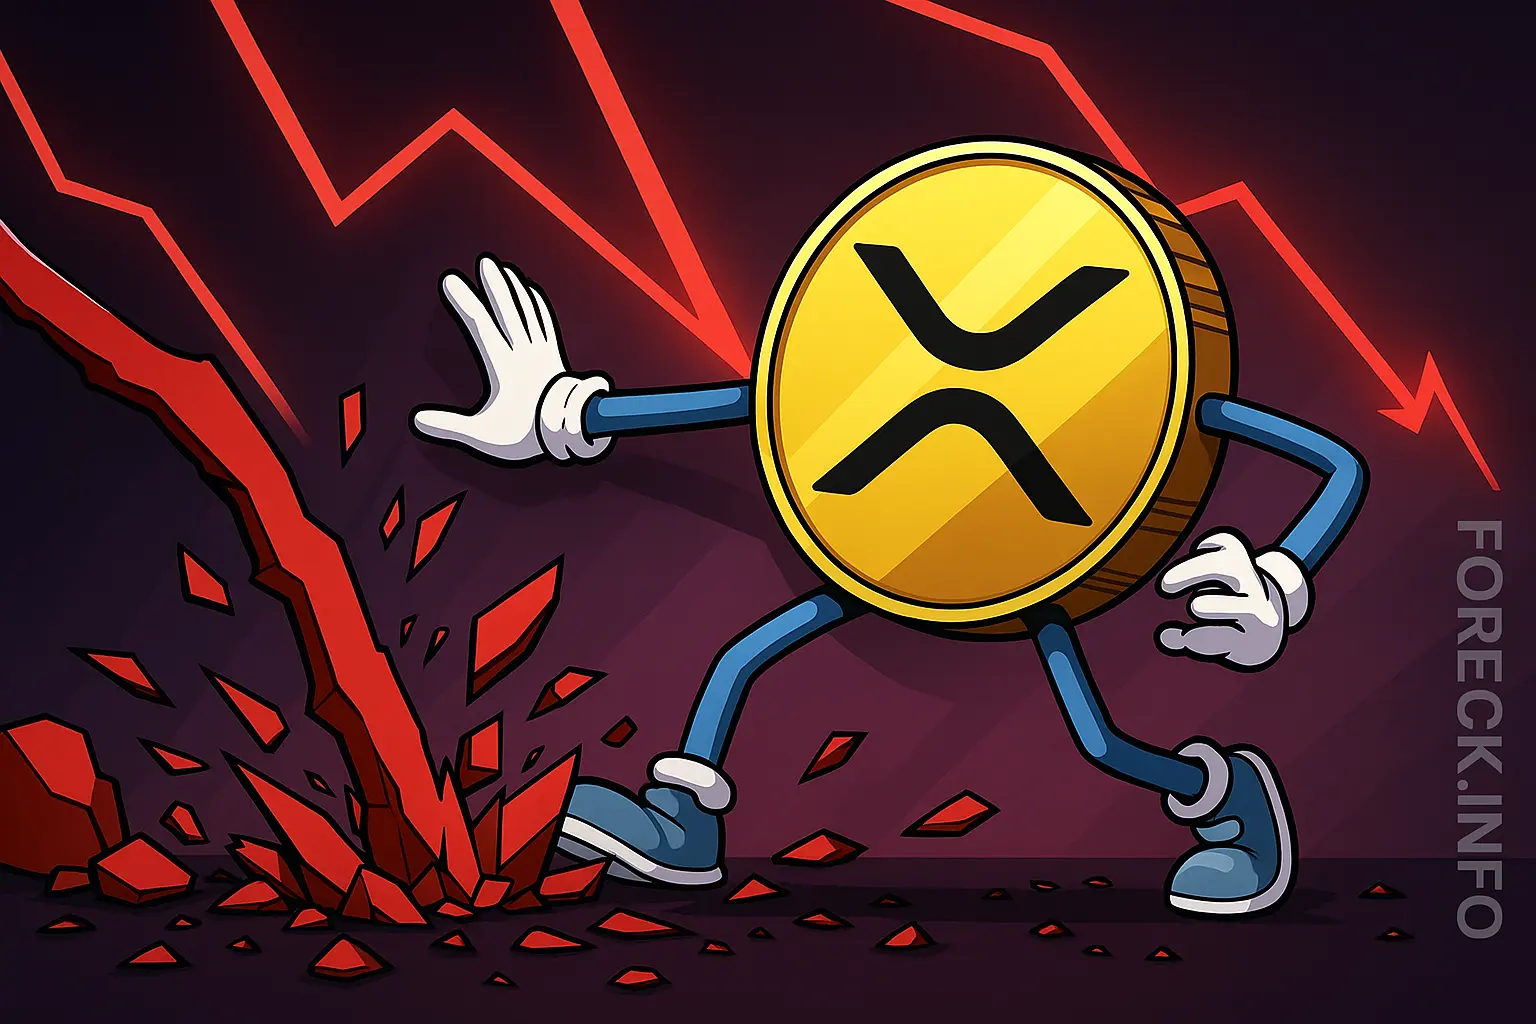
 Could Ripple investors face major losses in 2026? Leading AI models have mapped out a worst-case scenario for XRP.
 By John Isige
 Bitcoin is posting its second-worst performance on record, while gold and oil are benefiting from the escalation in the Middle East
 By Andrew Bennett
 After yesterday’s airstrikes on Iranian targets, Bitcoin initially dropped sharply before quickly entering a strong recovery phase. What is behind the market’s rapid reaction?
 By John Isige
 Over the past three years, Tether has frozen approximately $4.2 billion worth of USDT. These measures were linked to suspected money laundering activities.
 By Andrew Bennett
 PAX Gold is surging sharply following US and Israeli strikes on Iran, while Bitcoin and the broader crypto market remain under pressure. This raises the key question of whether the move is sustainable. Bitcoin briefly dropped toward the $63,000 level, altcoins are posting notable losses, and total cryptocurrency market capitalization has declined by around 4%. Amid the sell-off, only a handful of digital assets are showing gains — one of them is PAX Gold (PAXG). The catalyst has been the recent US and Israeli strikes on Iran.
 By John Isige
 Ripple CEO Brad Garlinghouse said he had a private meeting with former U.S. Securities and Exchange Commission (SEC) Chair Gary Gensler, which, according to Garlinghouse, took place at the White House. During the conversation, Gensler allegedly apologized for his stance on XRP, saying: “I’m sorry, I was wrong.”
 By Andrew Bennett
 Following U.S. and Israeli strikes on Iran, financial markets came under pressure. Bitcoin fell sharply, with millions of dollars in long positions liquidated.
 By Andrew Bennett
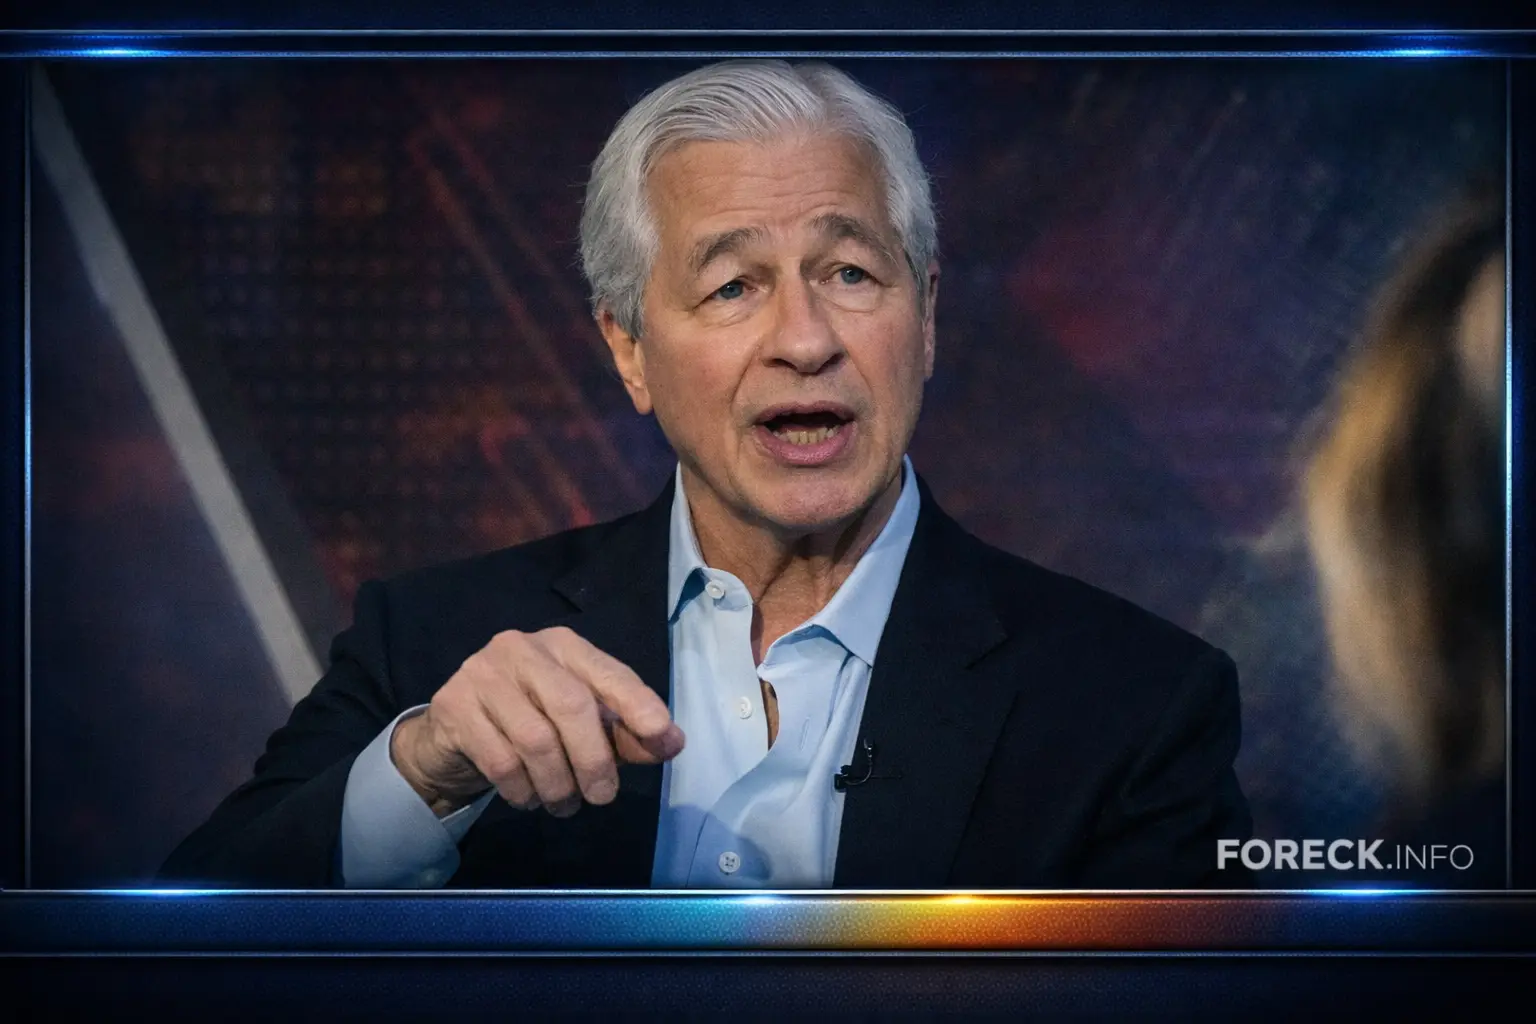
 Jamie Dimon’s banking giant is unexpectedly turning bullish on crypto — and is setting clear conditions for a major market rally.


For crypto, the framework is similar to traditional financial markets but comes with its own twist. Here, price action turns on liquidity, adoption, regulation, and flows from institutions alongside retail sentiment. Network health—hash rate, staking, active wallets—adds another layer. Macro still matters too: rates, dollar strength, and risk appetite shape inflows and outflows. Then, as with any market, you use the chart—trend, support and resistance, momentum, and volume—to spot setups and manage risk.