

Top Pick
- Fully licensed and regulated US exchange
- Strong focus on security and compliance
- User-friendly interface for beginners

The cryptocurrency market strengthened earlier this week but came under sharp selling pressure on Thursday, erasing much of its previous gains. In the latest market snapshot, Bitcoin (BTC) is trading near 81600.00 (+0.9%), Ethereum (ETH) at 2400.00 (+2.1%), Tether (USDT) at 0.9991 (–0.01%), BNB at 744.00 (+5.1%) and XRP at 1.3250 (+4.8%). Total cryptocurrency market capitalization has declined to approximately $2.73 trillion, while Bitcoin dominance has increased to 60.0%. From October 19 to 22, US spot Bitcoin ETFs recorded net inflows of $439.1 million, while Ethereum ETFs saw outflows of $225.1 million. The market remains volatile despite the recovery attempt discussed in our previous crypto weekly review.
 By John Isige
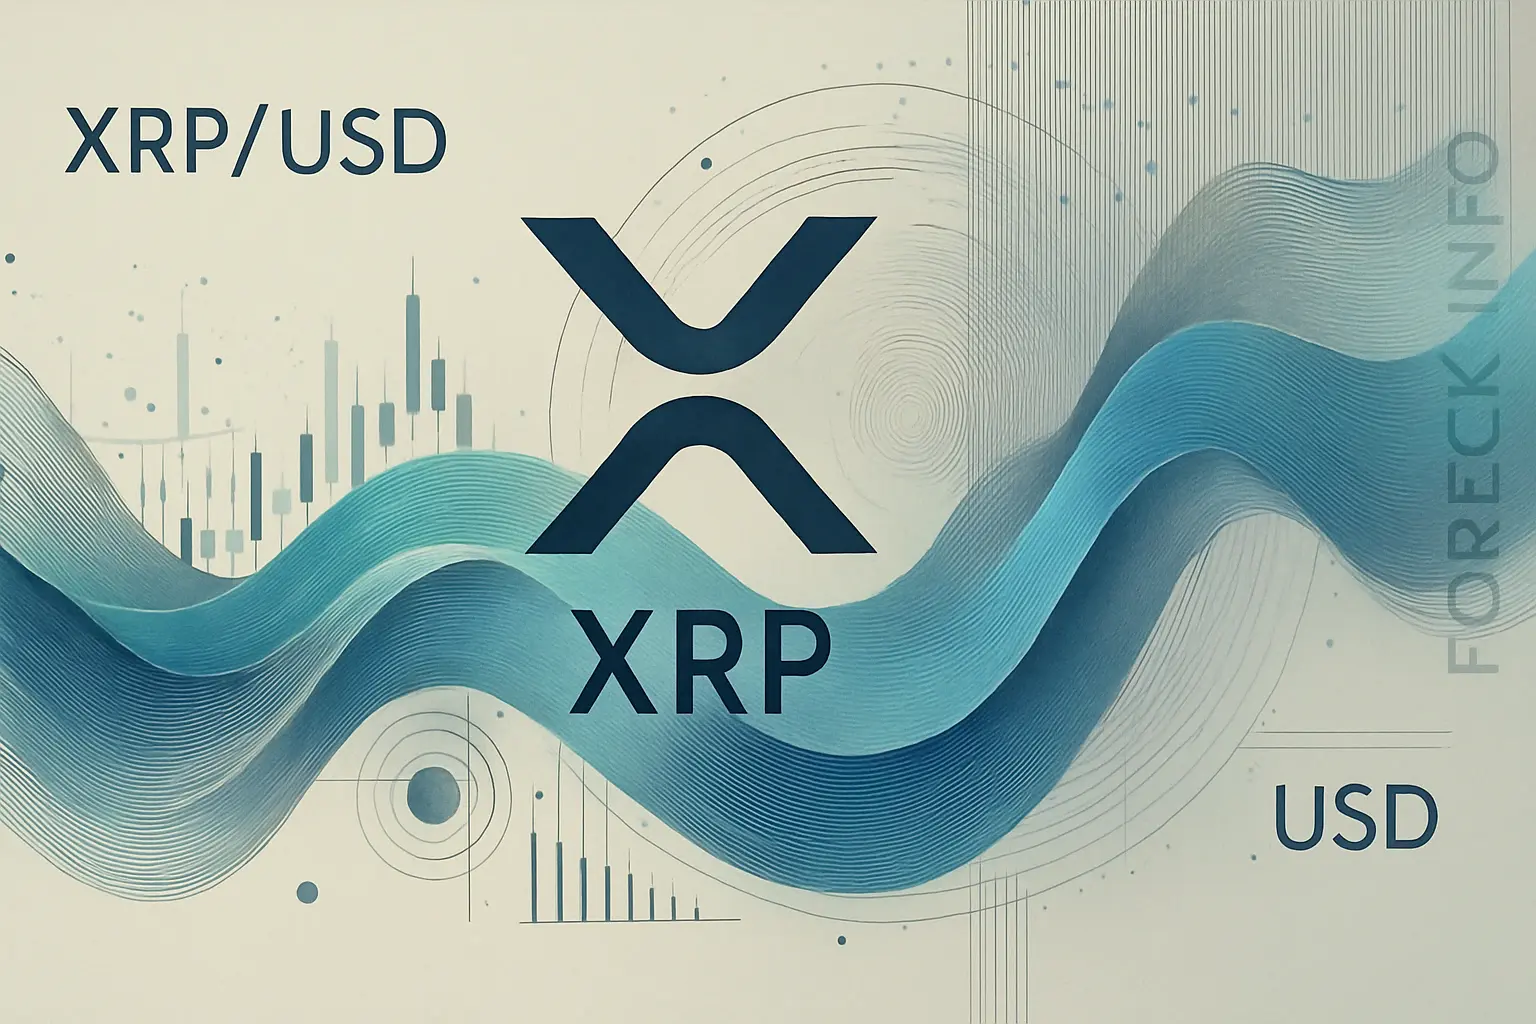
 The XRP/USD pair has stabilized around 0.6400 this week as investors maintain a cautious stance ahead of the U.S. Federal Reserve’s interest rate decision at 20:00 (GMT+2) and tomorrow’s meeting between President Donald Trump and China’s Xi Jinping.
 By John Isige
 Evernorth Holdings, an investment firm backed by Ripple, has purchased over $1 billion worth of XRP to establish the world’s largest public crypto treasury.
 By John Isige
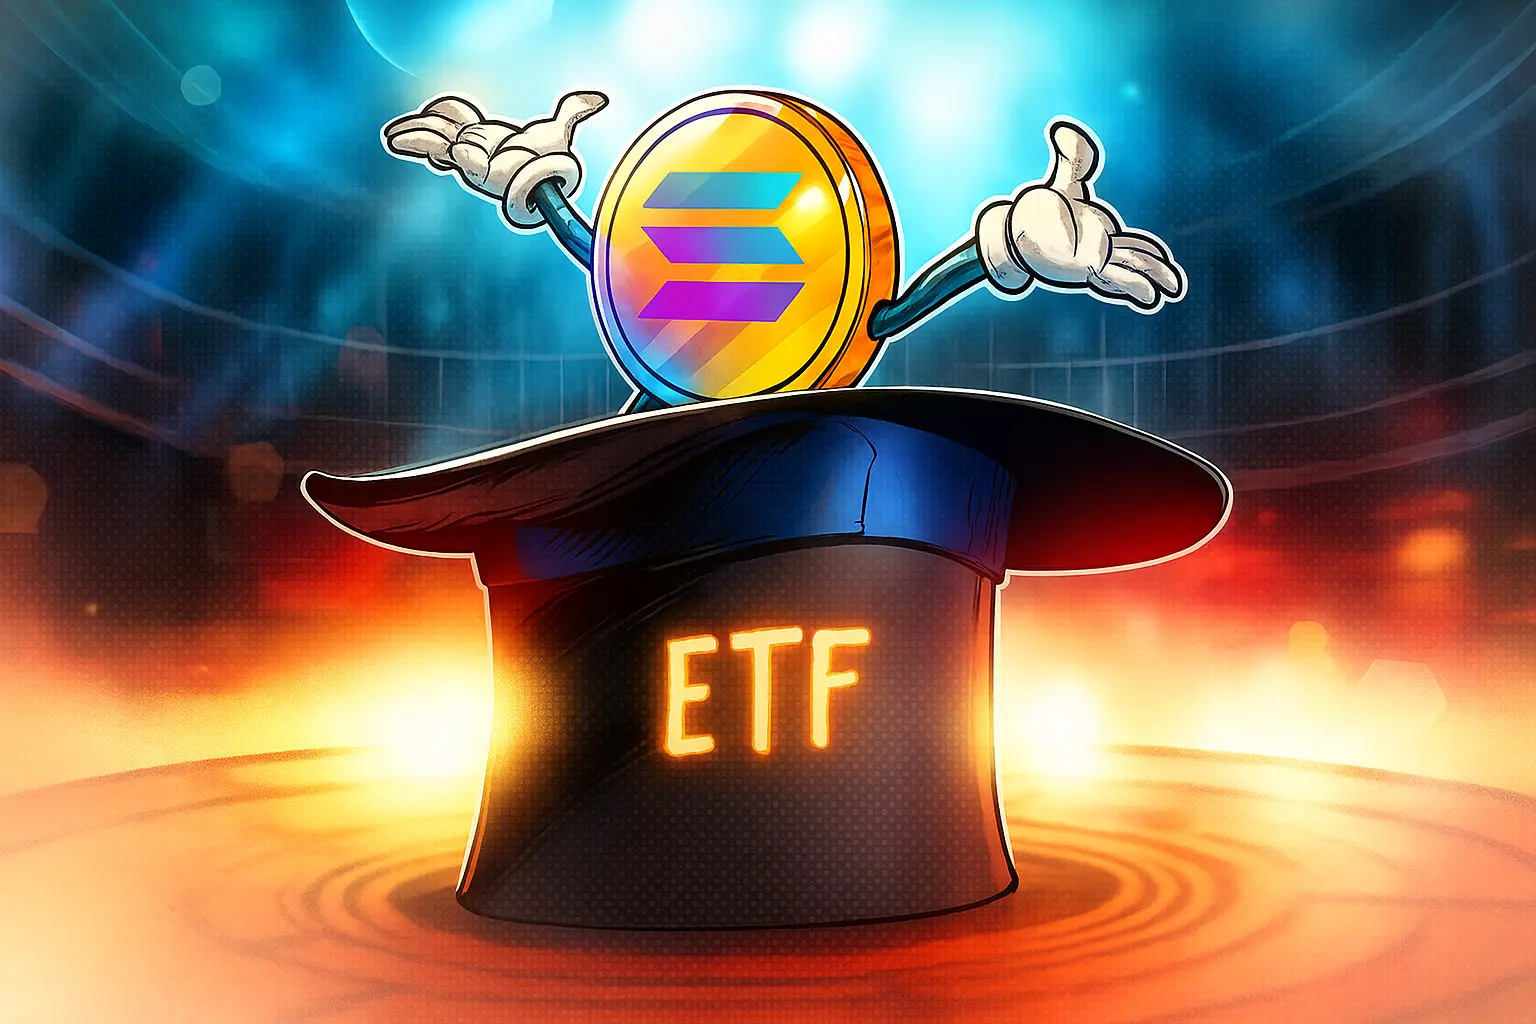
 On October 28, trading began on the New York Stock Exchange (NYSE) for the new spot exchange-traded fund (ETF) based on Solana, launched by Bitwise under the ticker BSOL.
 By John Isige
 Western Union has launched a pilot program to settle transactions using stablecoins. The news came during the company’s third-quarter earnings call.
 By John Isige
 The ETH/USD pair continues to form a medium-term downtrend, correcting within a long-term uptrend. Last week, the price reached 3750.00 (Murray level [4/8]) at the lower boundary of the descending channel but failed to break lower and resumed growth. Currently, the price has consolidated above 3962.50 (Murray level [5/8], Fibonacci correction 23.6%), supported by the middle Bollinger Band. However, confirmation of an uptrend will only occur after the price secures above 4375.00 (Murray level [6/8]) with a breakout of the upper boundary of the ascending channel — in this case, the movement could continue toward 5000.00 (Murray level [8/8]) and 5625.00 (Murray level [+2/8]). The key level for the “bears” remains 3750.00 (Murray level [4/8]): consolidation below it could trigger further decline toward 3125.00 (Murray level [2/8], Fibonacci correction 50.0%) and 2500.00 (Murray level [0/8]).
 By John Isige
 At the Financial Street Forum 2025 in Beijing, People’s Bank of China Governor Pan Gongsheng warned that stablecoins are becoming a growing threat to global financial stability and national monetary sovereignty.
 By John Isige
 Last week, the BTC/USD pair resumed its upward movement, testing the 115,625.00 level (Murray level [5/8]) today. Investor appetite for risk assets returned amid expectations of a Federal Reserve rate cut on Wednesday and an upcoming meeting between U.S. President Donald Trump and Chinese President Xi Jinping at the Asia-Pacific Economic Cooperation (APEC) summit in Seoul later this week.
 By John Isige
 Solana co-founder Anatoly Yakovenko criticized the security and decentralization of Ethereum’s second-layer (Layer-2) scaling solutions.
 By John Isige
 The privacy coin Zcash is experiencing a real “second spring.” Over the past 24 hours, the price of ZEC has surged by 20% to reach $350 — its highest level since 2017. Meanwhile, its market capitalization has surpassed $5 billion for the first time.
 By John Isige
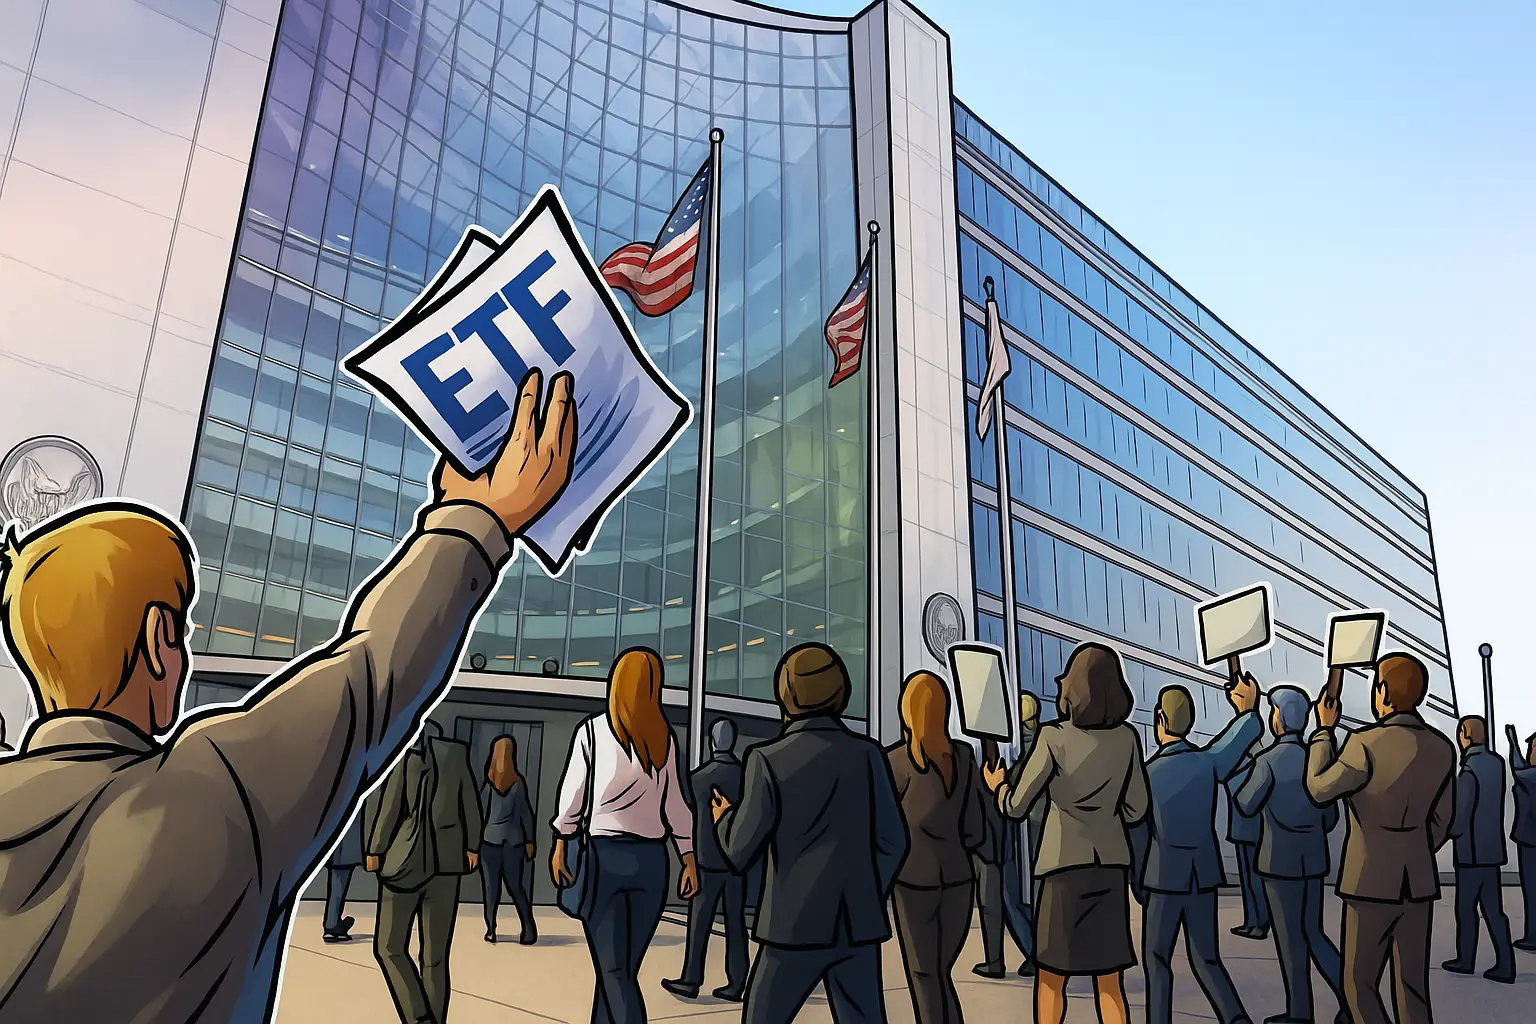
 The first exchange-traded fund (ETF) based on the XRP token has surpassed $100 million in assets under management (AUM).
 By John Isige
 The native token of Humanity Protocol — H — after gaining more than 190% over the past week, reached a new all-time high of $0.3887 before stabilizing near $0.31, according to CoinMarketCap. The project’s market capitalization exceeded $720 million, while daily trading volume jumped by 469% to $476 million.
 By John Isige
 Cardano (ADA) has recently shown signs of stabilization and potential growth.


For crypto, the framework is similar to traditional financial markets but comes with its own twist. Here, price action turns on liquidity, adoption, regulation, and flows from institutions alongside retail sentiment. Network health—hash rate, staking, active wallets—adds another layer. Macro still matters too: rates, dollar strength, and risk appetite shape inflows and outflows. Then, as with any market, you use the chart—trend, support and resistance, momentum, and volume—to spot setups and manage risk.