
Avalanche (AVAX) is presenting an increasingly bullish technical picture. On the daily chart, a classic W-formation was recently resolved to the upside—a key sign of renewed market strength. This breakout saw AVAX not only clear its 50-day EMA but also push through the 200-day EMA, marking a significant milestone within its mid-term price structure.
After the breakout, AVAX advanced toward the 800-day EMA, only to encounter robust horizontal resistance in a key red zone. This prompted profit-taking and a temporary pullback, which was effectively cushioned by the 200-day EMA, now serving as dynamic support and providing price stability.
Key Level: 800 EMA and Thin Volume Zone
The technical spotlight is now on the 800-day EMA region. A decisive break above this resistance could pave the way for a much stronger rally. The visible range volume profile (VPVR) highlights a historical “volume vacuum” between current prices and the $35 level. Should a breakout occur, the lack of prior trading activity in this zone raises the odds of a swift price impulse.
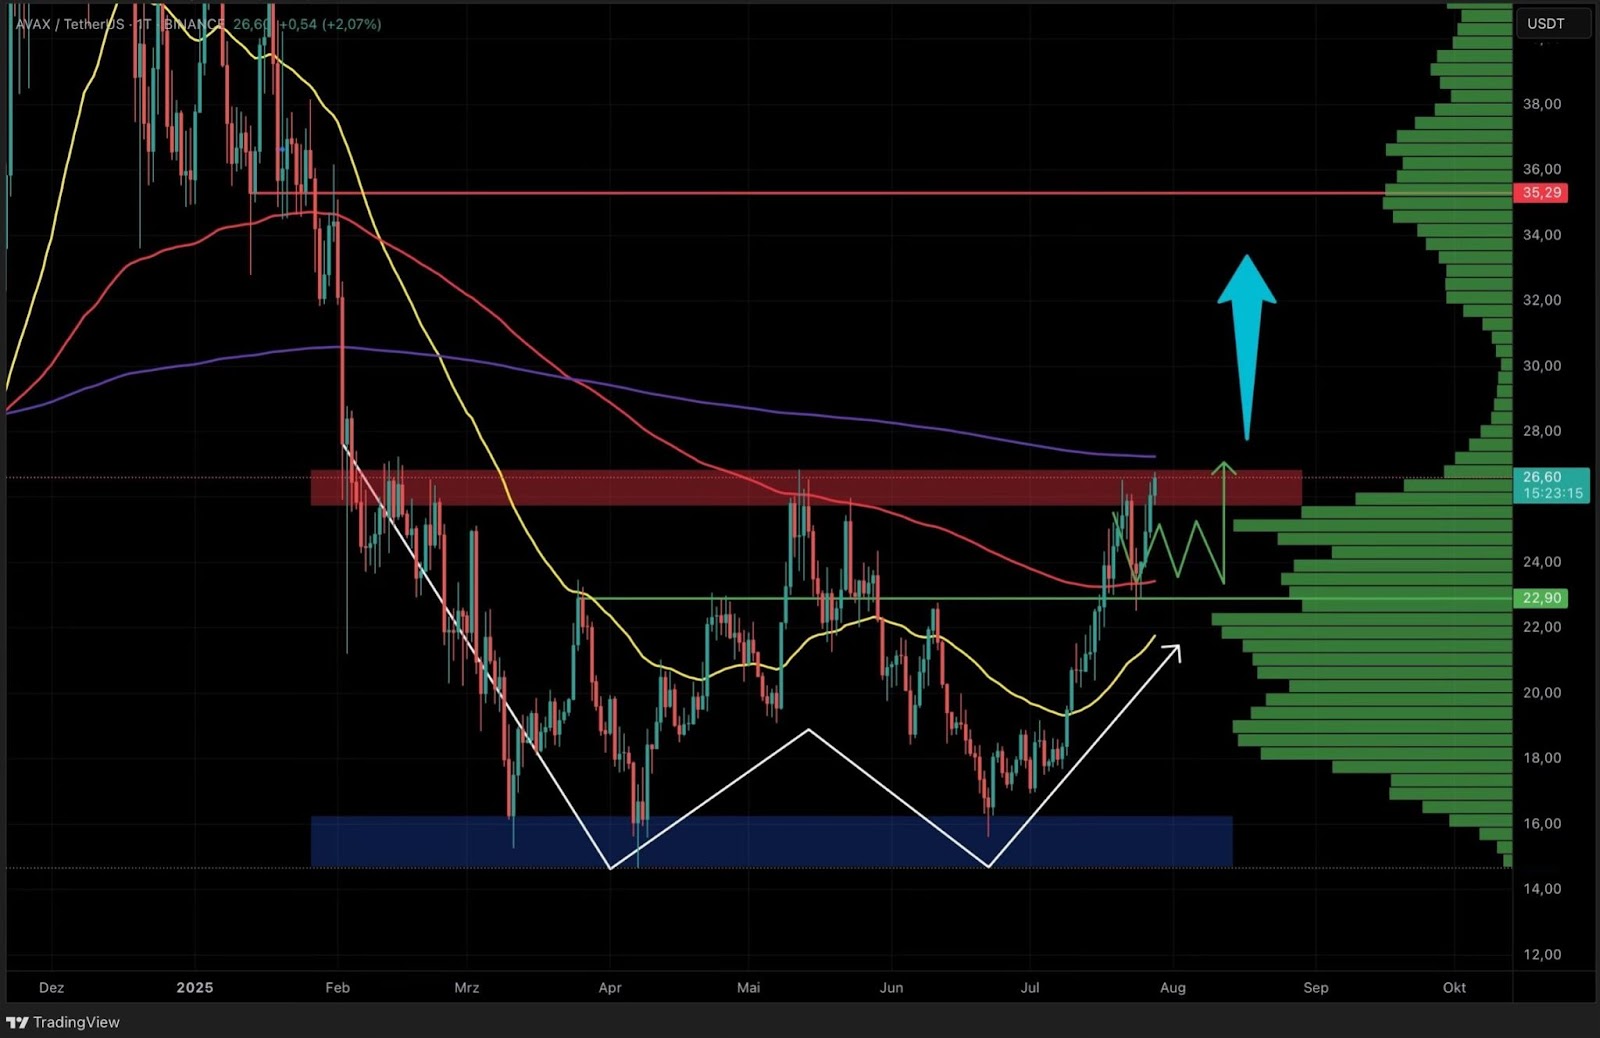 AVAX daily chart: resistance and support in focus. Tradingview
 4-Hour Chart: Structural Break Supports Bullish Scenario
The latest correction in the 4-hour timeframe appears to be a healthy retracement within the prevailing uptrend. The pullback found support right at the 800 EMA—a zone that has repeatedly acted as a reaction area in the past and now confirms its role as dynamic support.
From this level, AVAX rapidly recovered and surpassed its previous local high, a break of structure that signals bullish continuation potential. Despite rising long positioning and an accumulation of liquidity below current prices, the overall market structure remains pro-cyclical. As long as there are no pronounced sell reactions, the buying momentum continues to dominate.
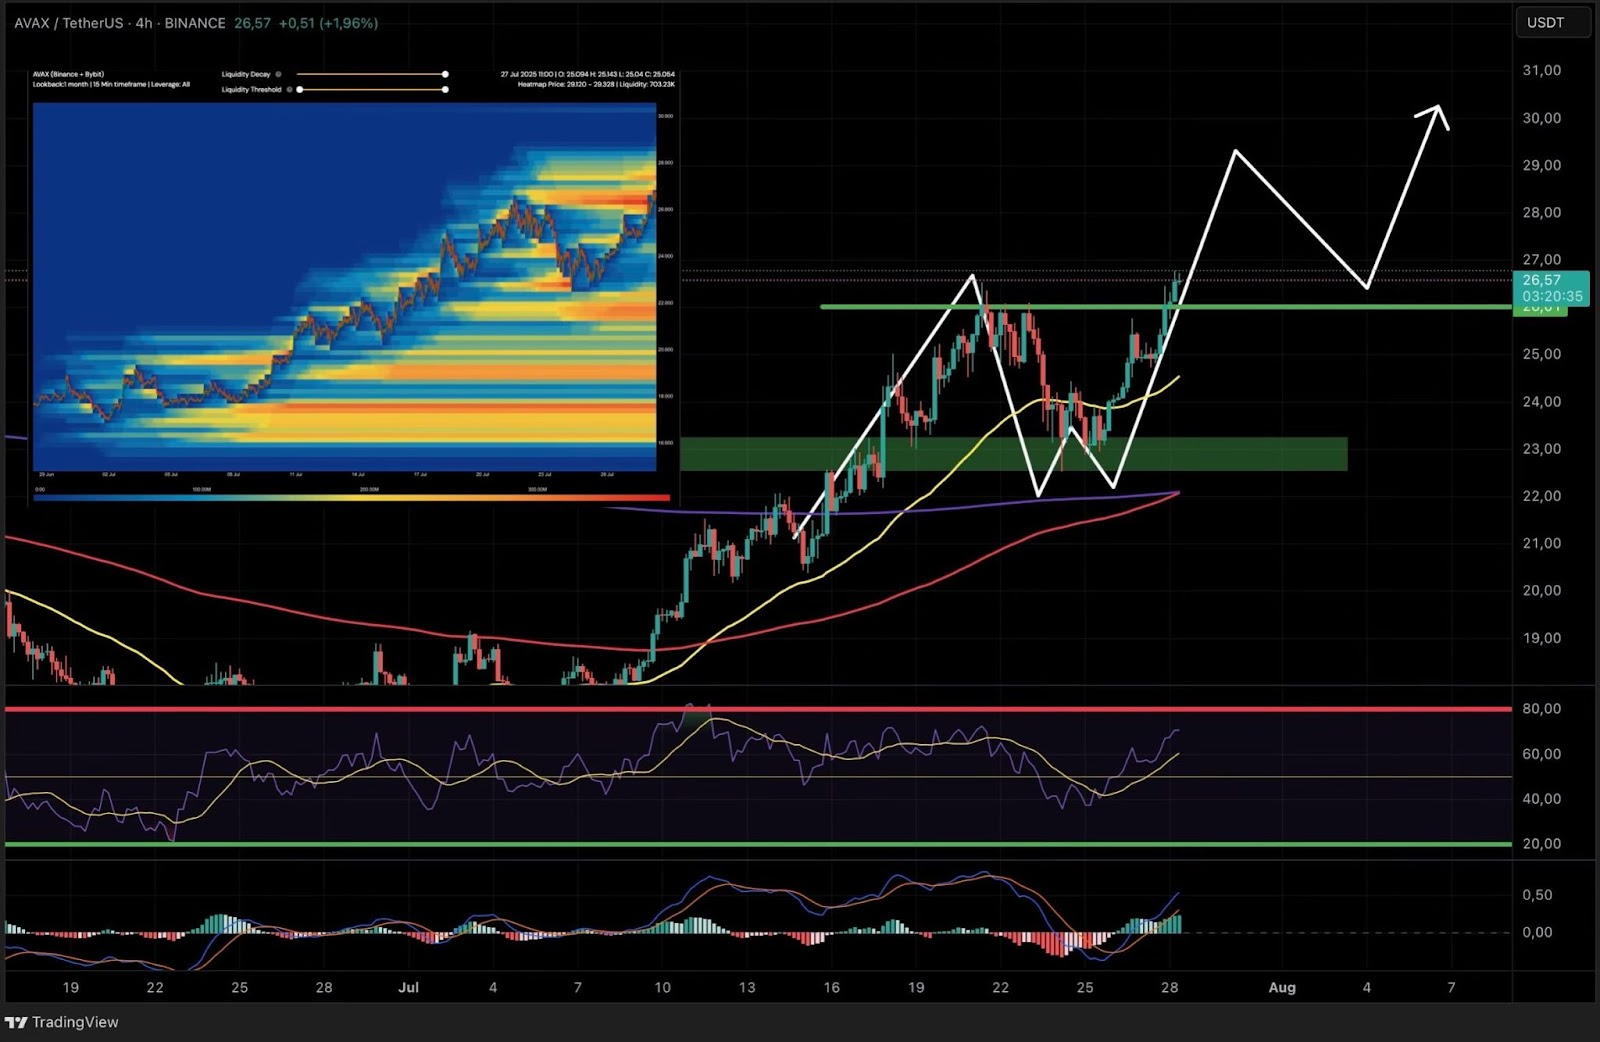 AVAX 4h chart: structure break and support zones. Tradingview