

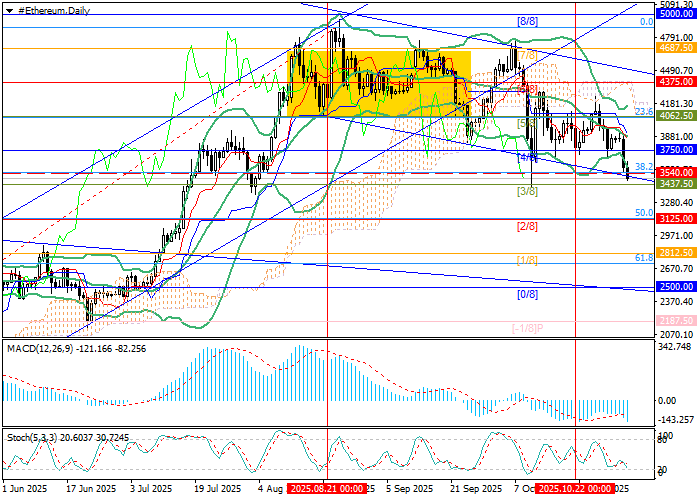
Technical indicators support the bearish outlook: Bollinger Bands are turning downward, and the MACD histogram is expanding in the negative zone, while the Stochastic indicator is approaching the oversold area, signaling a possible short-term correction.
Support and resistance levels
Resistance: 4062.50, 4687.50, 5000.00.
Support: 3540.00, 3125.00, 2500.00.
Trading scenarios and ETH/USD forecast
Short positions may be opened below 3750.00 with targets at 3125.00 and 2500.00, and a stop loss at 3740.00. Implementation period: 5–7 days.
Long positions may be opened above 4062.50 with targets at 4687.50 and 5000.00, and a stop loss at 3660.00.
Scenario
| Timeframe | Weekly |
| Recommendation | SELL STOP |
| Entry point | 3470.00 |
| Take Profit | 3125.00, 2500.00 |
| Stop Loss | 3740.00 |
| Key levels | 2500.00, 3125.00, 3540.00, 4062.50, 4687.50, 5000.00 |
Alternative scenario
| Recommendation | BUY STOP |
| Entry point | 4065.00 |
| Take Profit | 4687.50, 5000.00 |
| Stop Loss | 3660.00 |
| Key levels | 2500.00, 3125.00, 3540.00, 4062.50, 4687.50, 5000.00 |