

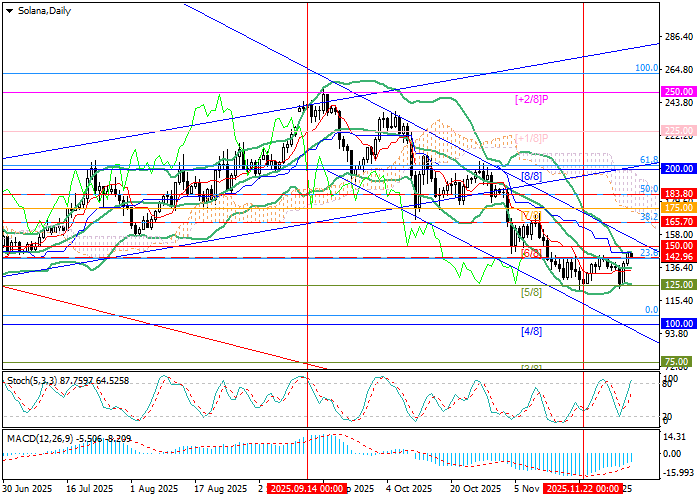
Technical indicators still point to a bearish trend: Bollinger Bands are directed downward, the MACD histogram remains stable in the negative zone, and the Stochastic is approaching the overbought area, suggesting a possible downward reversal. It is also worth noting that the weekly chart shows signs of a potential “double top” formation, which supports the likelihood of a decline toward 93.75 (Murray level [3/8], W1).
Support and Resistance Levels
Resistance levels: 165.70, 200.00, 250.00.
Support levels: 125.00, 100.00, 75.00.
SOL/USD Trading Scenarios and Forecast
Short positions may be opened below 125.00 with targets at 100.00 and 75.00, and a stop-loss at 142.90. Estimated duration: 5–7 days.
Long positions may be opened above 165.70 with targets at 200.00 and 250.00, and a stop-loss at 145.00.
Scenario
| Timeframe | Weekly |
| Recommendation | SELL STOP |
| Entry Point | 123.80 |
| Take Profit | 100.00, 75.00 |
| Stop Loss | 142.90 |
| Key Levels | 75.00, 100.00, 125.00, 165.70, 200.00, 250.00 |
Alternative Scenario
| Recommendation | BUY STOP |
| Entry Point | 166.00 |
| Take Profit | 200.00, 250.00 |
| Stop Loss | 145.00 |
| Key Levels | 75.00, 100.00, 125.00, 165.70, 200.00, 250.00 |
