

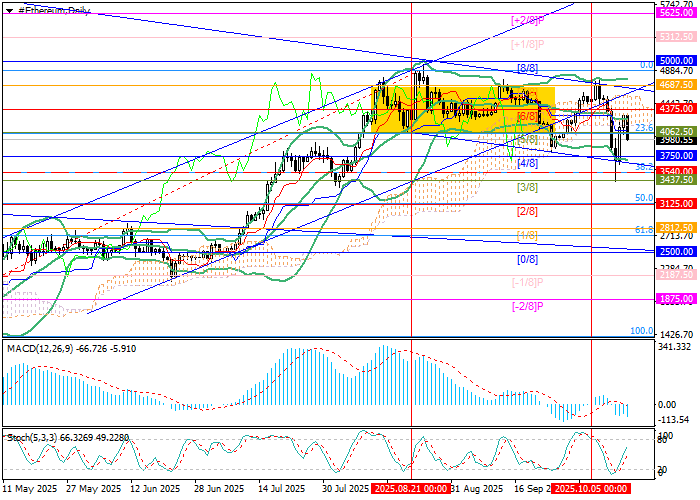
Technical indicators confirm a developing bearish trend. Bollinger Bands are turning downward, MACD is increasing in the positive zone, and the Stochastic is pointing upward but approaching the overbought area. On the weekly chart, the current price structure resembles a “flag” pattern, which is not yet complete — meaning the downside potential remains.
Support and Resistance Levels
Resistance levels: 4687.50, 5000.00, 5625.00.
Support levels: 3540.00, 3125.00.
Trading Scenarios and ETH/USD Forecast
Forecast: Short positions may be opened from 3940.00 with targets at 3540.00 and 3125.00, stop-loss at 4240.00. Implementation period: 5–7 days.
Long positions may be considered above 4687.50 with targets at 5000.00 and 5625.00, stop-loss at 4475.00.
Scenario
| Timeframe | Weekly |
| Recommendation | SELL STOP |
| Entry Point | 3940.00 |
| Take Profit | 3540.00, 3125.00 |
| Stop Loss | 4240.00 |
| Key Levels | 3125.00, 3540.00, 4687.50, 5000.00, 5625.00 |
Alternative Scenario
| Recommendation | BUY STOP |
| Entry Point | 4720.00 |
| Take Profit | 5000.00, 5625.00 |
| Stop Loss | 4475.00 |