

According to analytics platform Santiment, whale holdings outside exchanges increased from 95.72M to 99.41M ETH in 24 hours — a net purchase of 3.69M ETH worth more than $16B. This suggests that large players are preparing for a bullish rally. An indirect confirmation of this recovery trend is the record stablecoin volume on Ethereum, which reached $165B, up $5B in just one week. Over the past 18 months, stablecoin supply in the Ethereum ecosystem has more than doubled, now standing at 158.5B. Ethereum maintains leadership with 57% of the global stablecoin market.
Another major driver for ETH/USD has been interest from large tech companies. In the last 30 days, they acquired roughly 2M ETH, bringing combined reserves to 4.71M ETH, valued at over $20.2B. Notable buyers include Bitmine Immersion Tech, SharpLink Gaming, and The Ether Machine. Beyond stablecoins, Ethereum also hit a record in tokenized gold, reaching about $2.4B, according to Token Terminal.
In September, staking dynamics shifted: new staking requests exceeded withdrawals for the first time. This factor eases downside pressure and shows growing confidence in Ethereum’s ecosystem. Data from Validator Queue indicates 774,956 ETH pending for staking (average wait time: 13 days), while withdrawal requests totaled 605,918 ETH with a wait time of about 10 days.
Meanwhile, U.S. labor data in August showed a significant slowdown: nonfarm payrolls fell from 79k to 22k (forecast: 75k), average hourly earnings dropped from 3.9% to 3.7% y/y, while unemployment rose to 4.3%, the highest in almost four years. This points to a weakening labor market and could justify a Fed rate cut at the September 17 meeting. According to the CME FedWatch Tool, the probability of a minimal cut is now 88.2%.
Support and resistance levels
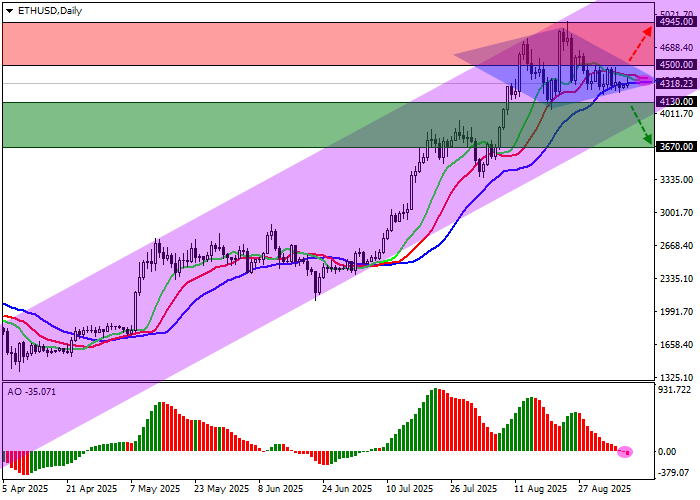
On the daily chart, a local correction is forming, but the price remains within an upward channel with dynamic boundaries of 4950.00–4000.00.
Technical indicators confirm the renewed downside scenario, maintaining a weak sell signal. The Alligator EMA range is trending downward, fast moving averages remain above the signal line, and the AO histogram recently moved into the sell zone, forming new bearish bars while staying close to the zero level.
-
Resistance levels: 4500.00, 4950.00
-
Support levels: 4130.00, 3670.00
Trading scenarios
-
If the asset continues to decline and consolidates below 4130.00, short positions become relevant with a target at 3670.00 and stop-loss at 4300.00. Implementation horizon: 7+ days.
-
If the price reverses upward and consolidates above 4500.00, long positions become relevant with a target at 4950.00 and stop-loss at 4300.00.
Scenario
-
Timeframe: Weekly
-
Recommendation: SELL STOP
-
Entry point: 4130.00
-
Take Profit: 3670.00
-
Stop Loss: 4300.00
-
Key levels: 3670.00, 4130.00, 4500.00, 4950.00
Alternative scenario
-
Recommendation: BUY STOP
-
Entry point: 4500.00
-
Take Profit: 4950.00
-
Stop Loss: 4300.00
-
Key levels: 3670.00, 4130.00, 4500.00, 4950.00