

Retail Activity Heats Up in Ethereum
The latest ETH rally can be traced directly to renewed short-term wallet engagement. Data from Glassnode’s HODL Waves metric, which categorizes tokens by their holding duration, reveal a noticeable uptick in coins held for short intervals—specifically the 1-week to 3-month bands, and even the ultra-long 10-year bracket. This uptick signals an influx of new wallets, pointing to a revival of retail interest that has been largely dormant in recent months.
Compared to the historical dominance of long-term holding cohorts, this sudden increase in short-term holding groups is noteworthy. It reflects a pivot toward active trading behavior—a key sign that fresh capital is cycling into the ecosystem.
HODL Waves provide a window into investor psychology: growth in short-term ranges often points to speculative buying, while expansion in long-term cohorts highlights confidence and cold storage. At this stage, both trends are apparent in Ethereum, underscoring the dual nature of current market activity.
On-Chain Wallet Clusters Set the Stage
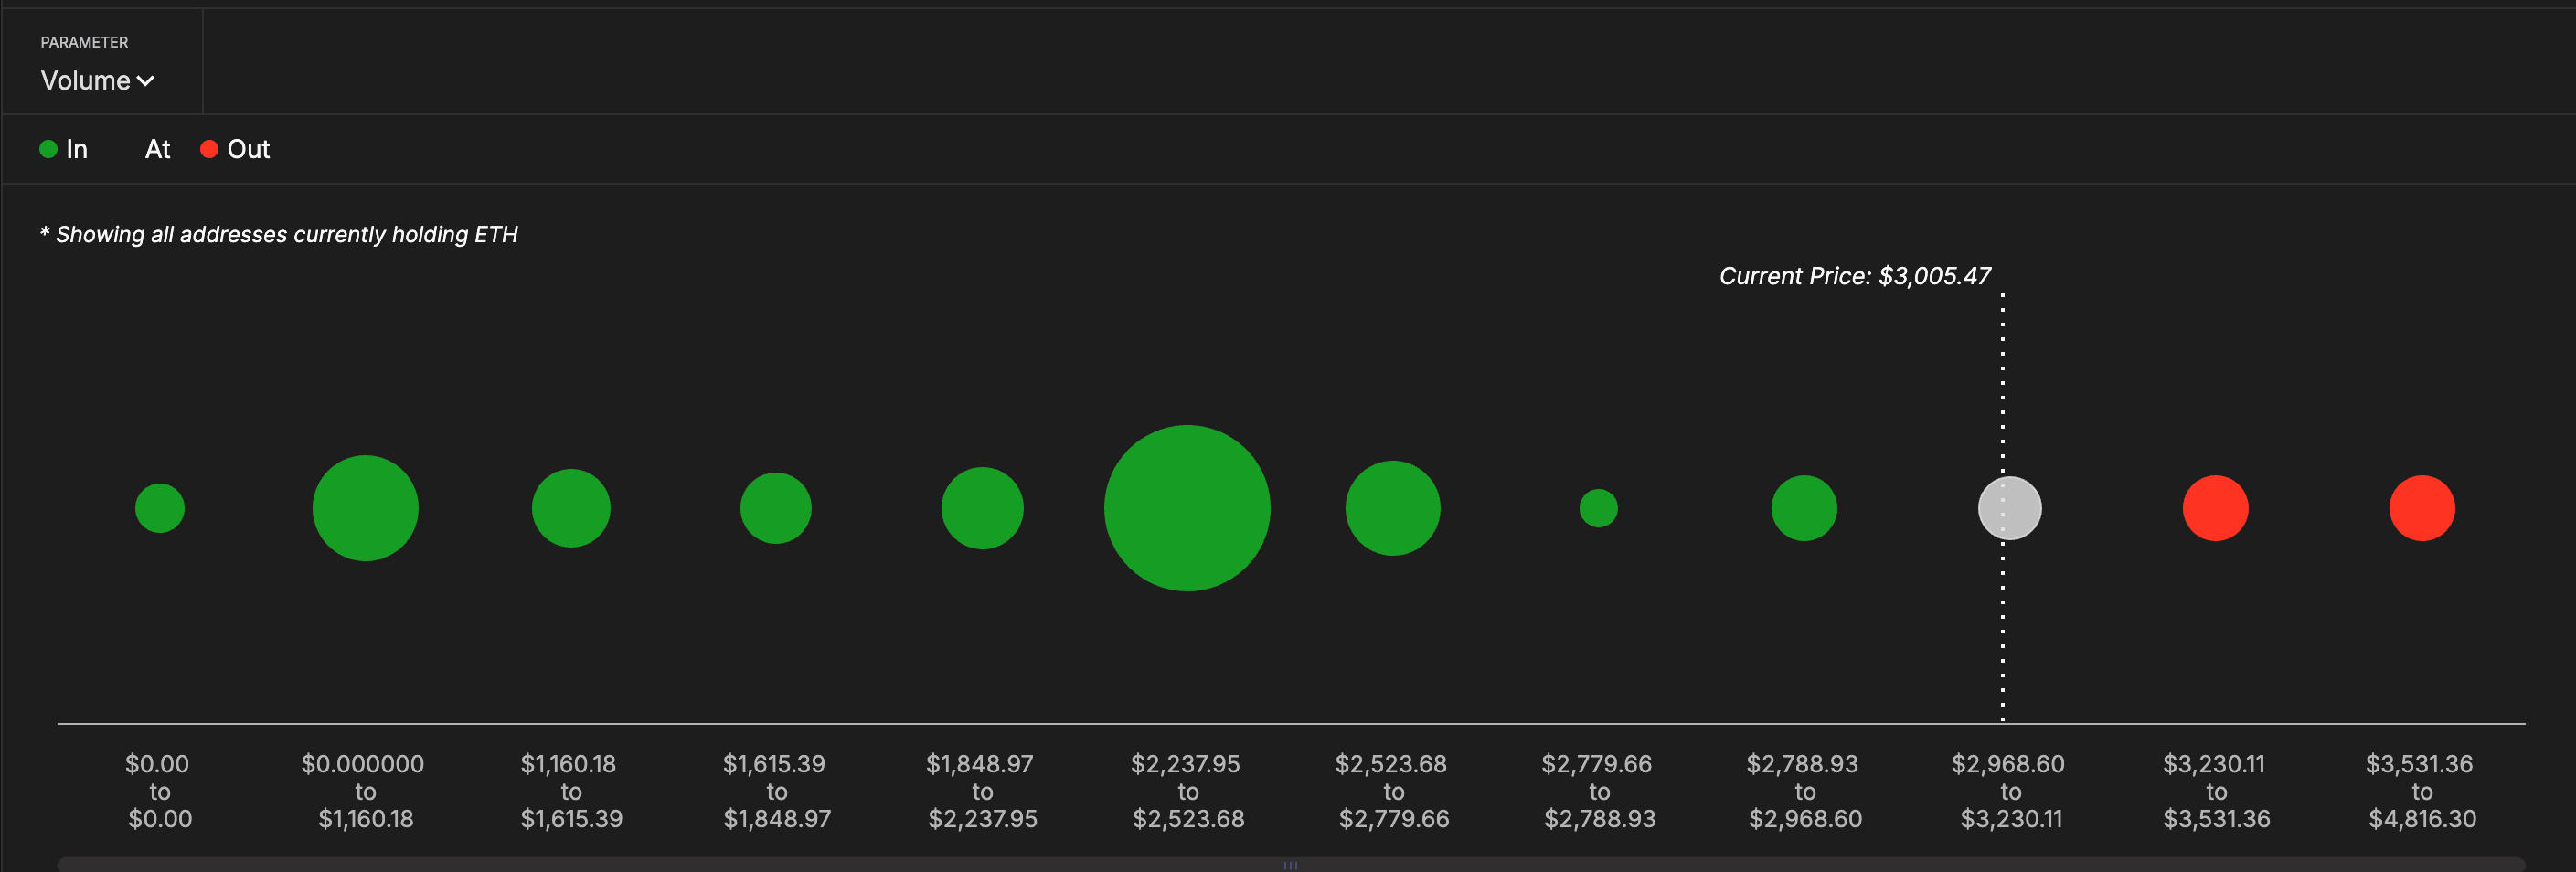
The most significant on-chain cluster for Ethereum now sits between $2,237 and $2,523. Millions of addresses acquired ETH within this price range and are currently in profit. Historically, such zones serve as strong support, as holders in the green tend to resist selling, stabilizing price action during pullbacks.
 Long-term vs. short-term holding in ETH wallets. Source IntoTheBlock
Above the $3,000 threshold, ETH is moving through a dense region of breakeven positions—between $2,968 and $3,230—where many holders are neither at a gain nor a loss. This cluster acts as a critical stress test for the current momentum. If Ethereum convincingly breaks above this zone, the path toward $3,500 opens up. Should momentum wane, a retracement toward $2,523 remains a strong possibility.
Technical Resistance: Fibonacci Levels and OBV Divergence
The most recent ETH rally has propelled the price into a critical resistance area at $3,045, defined by the 0.618 Fibonacci extension drawn from the $1,388 low, $2,869 high, and $2,123 correction. The next Fibonacci level at $3,295 (0.786) aligns almost perfectly with the upper band of wallet resistance. This confluence underscores the dual challenge facing Ethereum: overcoming both technical and behavioral hurdles.
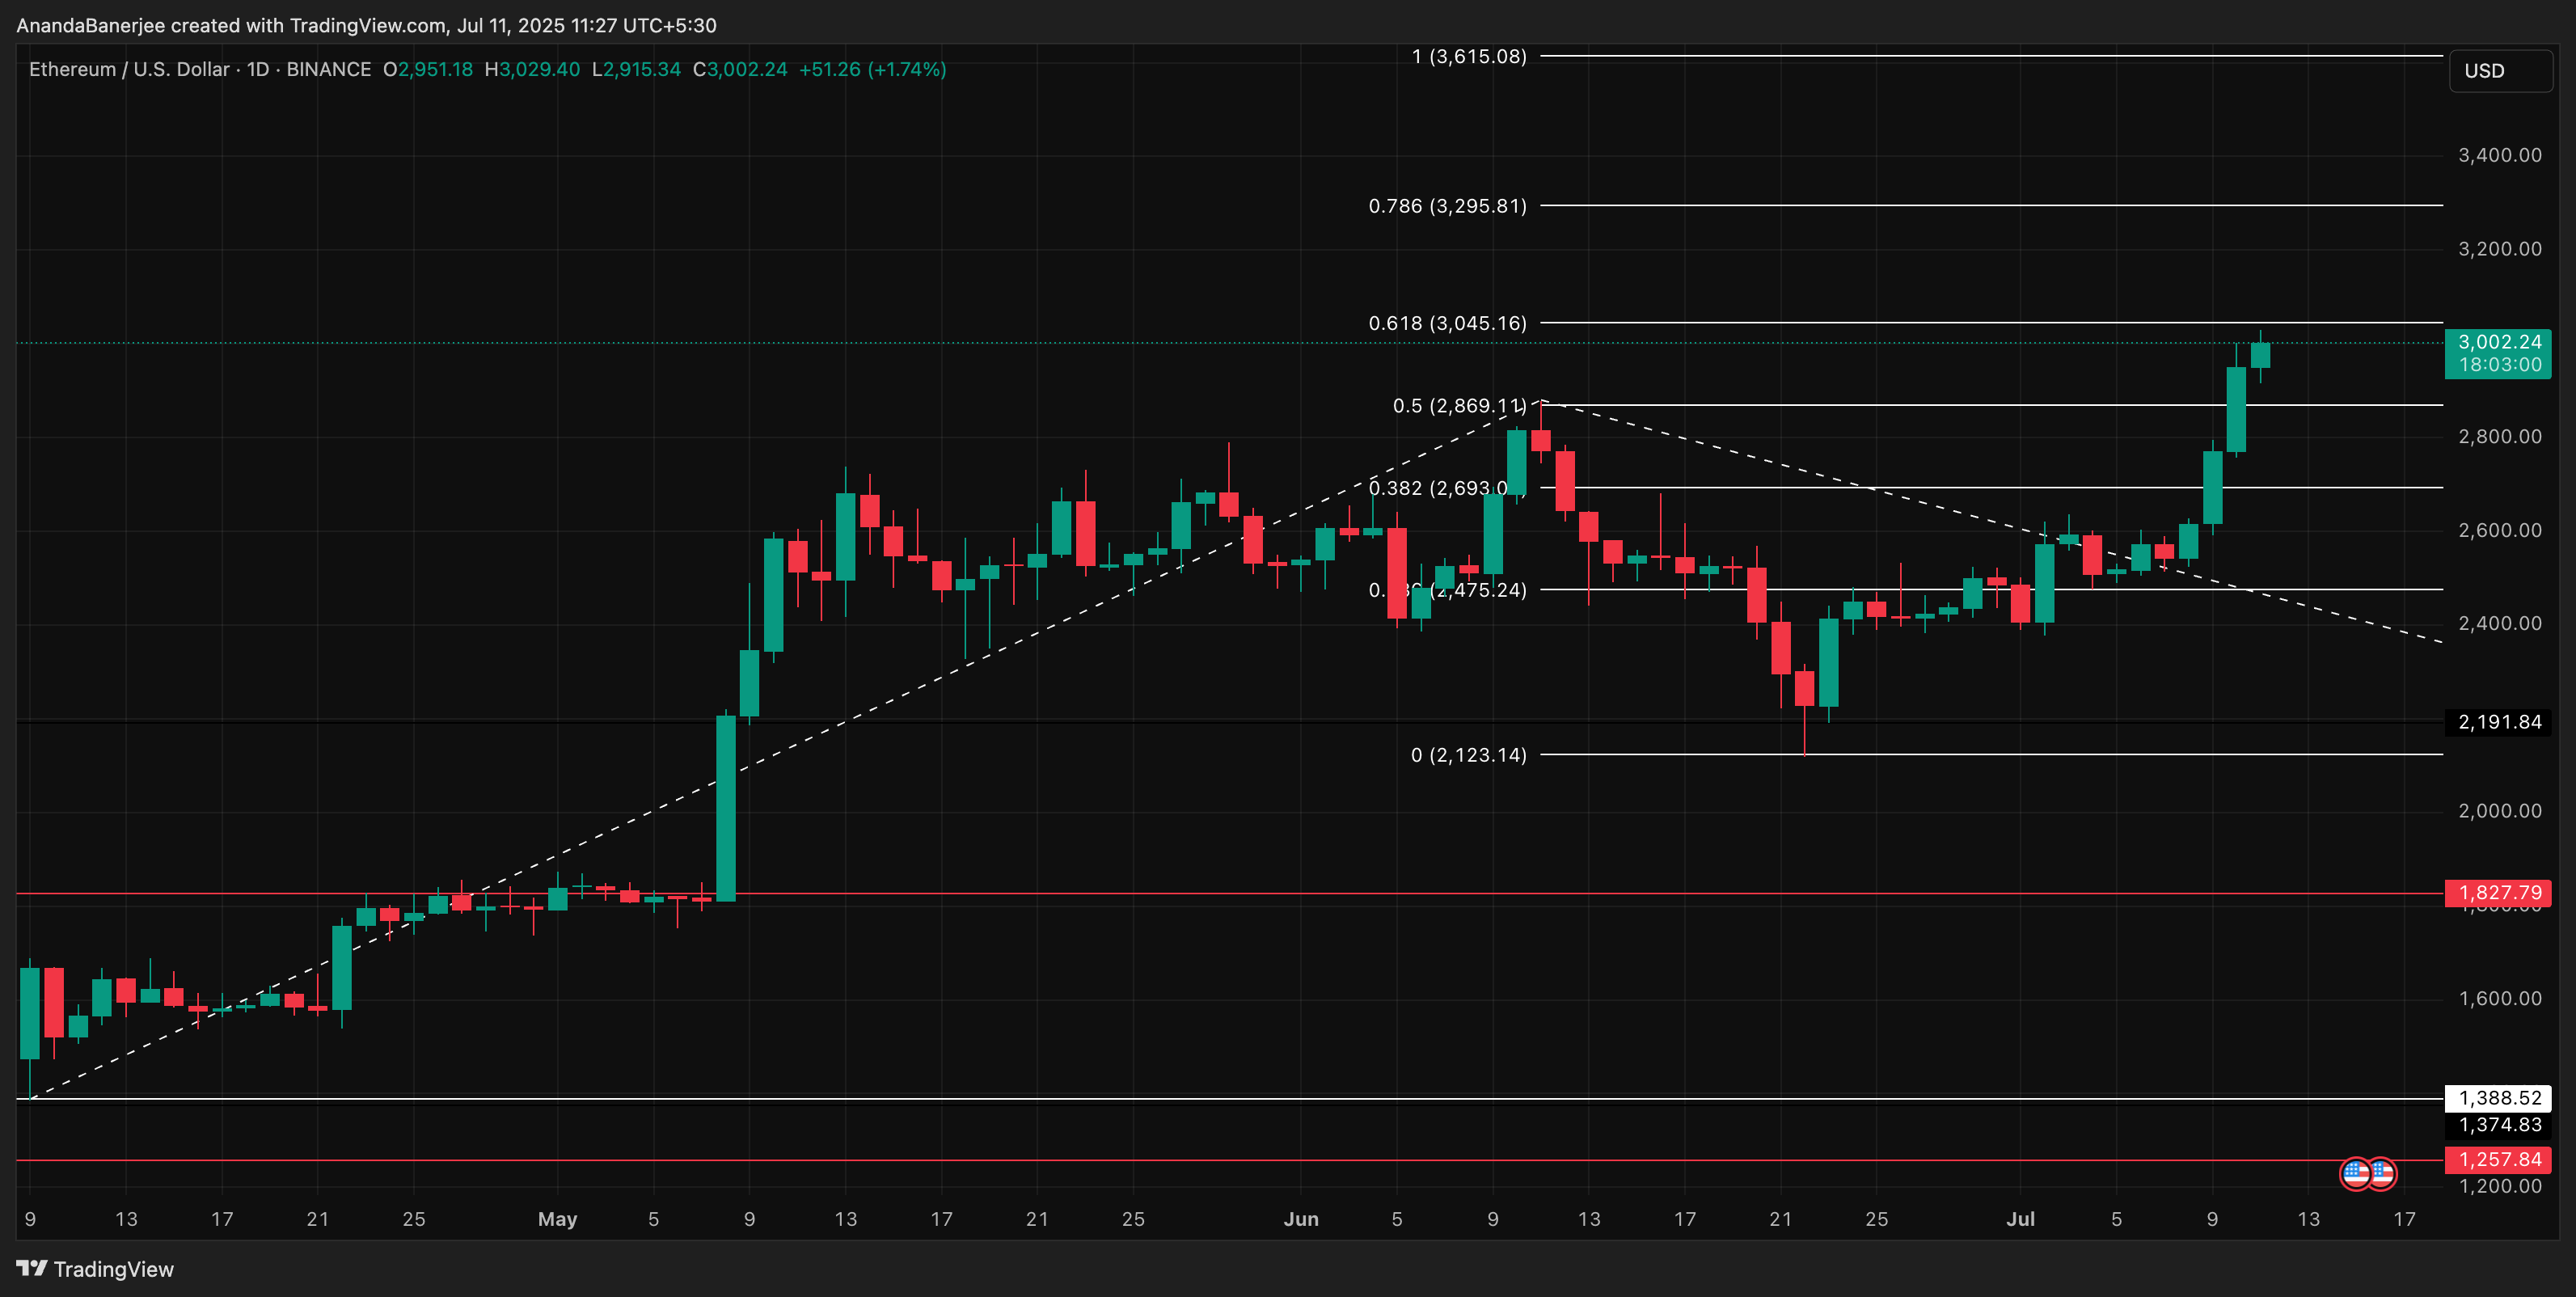 Key Fibonacci zones frame ETH price action. Source blockchaincenter.net
Should ETH sustain momentum beyond $3,230, the Fibonacci 1.0 extension at $3,615 becomes the logical upside target. However, market confirmation is required before this scenario unfolds.
On the cautionary side, the On-Balance Volume (OBV) indicator is signaling potential weakness. While ETH price has surged, OBV has yet to break above its previous high from the $2,890 price top. This negative divergence hints at underlying softness in spot demand—a situation that often precedes a pullback if not quickly resolved.
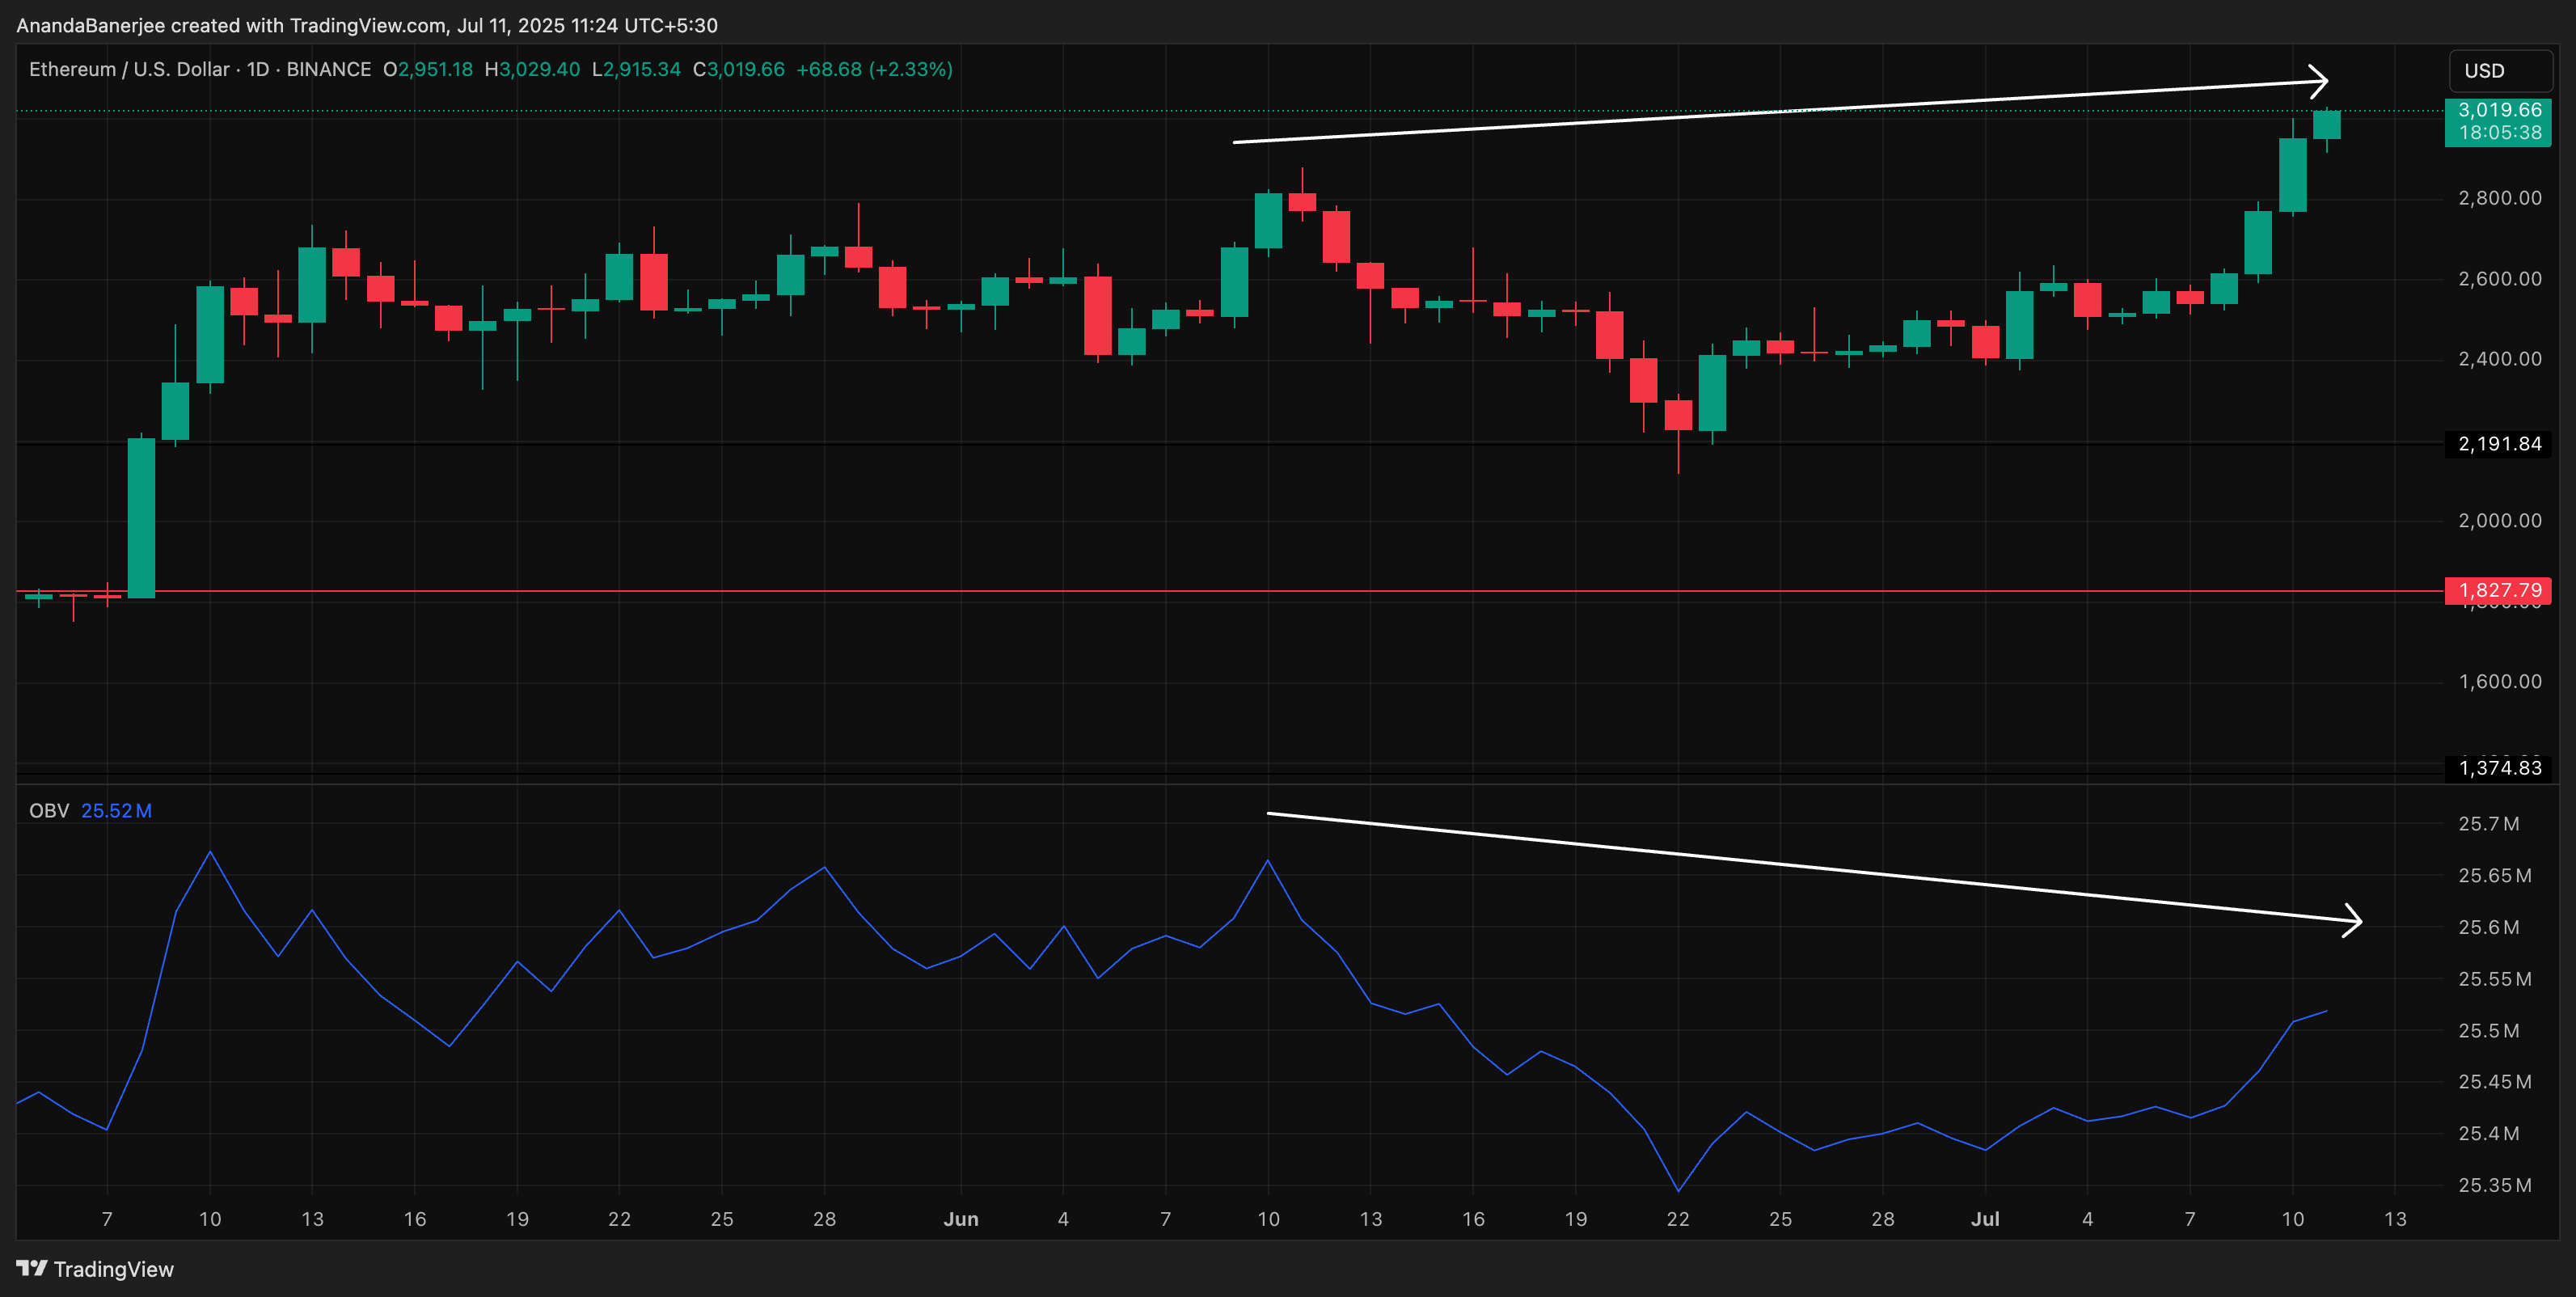 OBV divergence raises questions about rally strength. Source CoinMarketCap
Should ETH price fall below $2,693—confirming the 0.382 Fibonacci retracement—sellers may target support around $2,475. For now, the spotlight remains on the $3,045–$3,230 corridor, where both technical and psychological resistance are concentrated.