

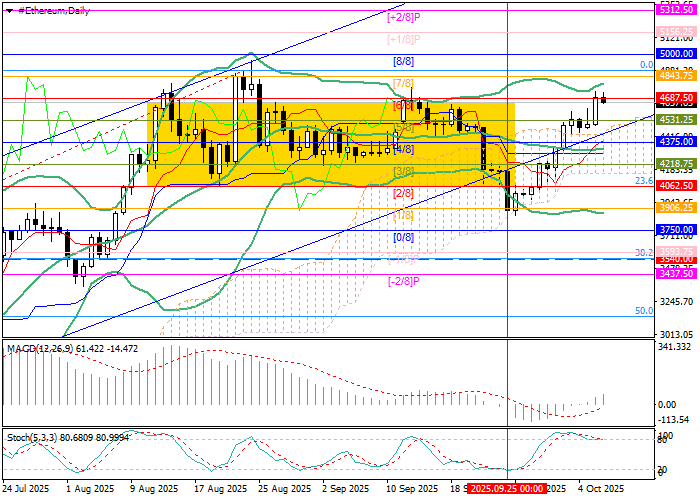
Currently, the price has returned to the upper boundary of the sideways trading range at 4687.50 (Murray level [6/8]). A breakout above this level could lead to a move toward 5000.00 (Murray level [8/8]) and 5312.50 (Murray level [+2/8]). However, if the price consolidates below the middle Bollinger Band at 4375.00 (Murray level [5/8]), the pair could exit the upward channel and decline toward 3906.25 (Murray level [2/8]) and 3540.00 (38.2% Fibonacci retracement).
Technical indicators remain mixed: Bollinger Bands are turning sideways, MACD histogram is expanding in the positive zone, while the Stochastic indicator is moving horizontally in the overbought area.
Additionally, the weekly chart continues to show a long-term uptrend, confirming the ongoing positive dynamics.
Support and resistance levels
Resistance levels: 4687.50, 5000.00, 5312.50.
Support levels: 4375.00, 3906.25, 3540.00.
Trading scenarios and Ethereum forecast
Long positions may be opened above 4687.50 with targets at 5000.00 and 5312.50, and a stop-loss at 4475.00. Implementation period: 5–7 days.
Short positions may be opened below 4375.00 with targets at 3906.25 and 3540.00, and a stop-loss at 4600.00.
Scenario
| Timeframe | Weekly |
| Recommendation | BUY STOP |
| Entry point | 4700.00 |
| Take Profit | 5000.00, 5312.50 |
| Stop Loss | 4475.00 |
| Key levels | 3540.00, 3906.25, 4375.00, 4687.50, 5000.00, 5312.50 |
Alternative scenario
| Recommendation | SELL STOP |
| Entry point | 4330.00 |
| Take Profit | 3906.25, 3540.00 |
| Stop Loss | 4600.00 |
| Key levels | 3540.00, 3906.25, 4375.00, 4687.50, 5000.00, 5312.50 |