

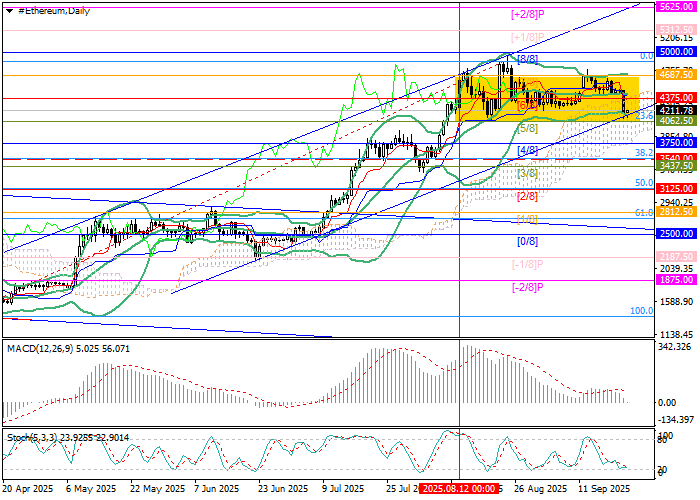
Technical indicators are mixed: Bollinger Bands remain flat, MACD is preparing to enter negative territory, while Stochastic has reached oversold levels and may turn upward. On the weekly chart, the broader uptrend remains intact, though a pullback to the midline of the Bollinger Bands near 3540.00 is still possible. In the short term, a deeper correction cannot be ruled out, but the long-term bullish structure is preserved.
Support and Resistance Levels
Resistance levels: 4687.50, 5000.00, 5312.50, 5625.00.
Support levels: 4062.50, 3540.00, 3125.00.
Ethereum Price Forecast and Trading Scenarios
Short positions may be considered below 4062.50, with targets at 3540.00 and 3125.00, and a stop loss at 4500.00. Estimated horizon: 5–7 days.
Long positions may be considered above 4687.50, with targets at 5000.00, 5312.50, and 5625.00, and a stop loss at 4490.00.
Scenario
| Timeframe | Weekly |
| Recommendation | SELL STOP |
| Entry Point | 4062.45 |
| Take Profit | 3540.00, 3125.00 |
| Stop Loss | 4500.00 |
| Key Levels | 3125.00, 3540.00, 4062.50, 4687.50, 5000.00, 5312.50, 5625.00 |
Alternative Scenario
| Recommendation | BUY STOP |
| Entry Point | 4687.55 |
| Take Profit | 5000.00, 5312.50, 5625.00 |
| Stop Loss | 4490.00 |
| Key Levels | 3125.00, 3540.00, 4062.50, 4687.50, 5000.00, 5312.50, 5625.00 |