

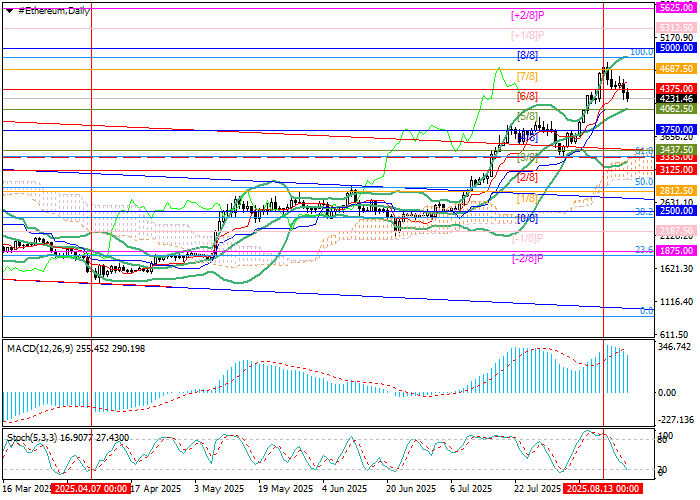
Currently, the price hovers near 4062.50 (Murray [5/8], Bollinger midline). A break below this level could extend the pullback toward 3335.00 (61.8% Fibonacci) and 2812.50 (Murray [2/8], 50.0% Fibonacci). For bulls, the key upside trigger is 4687.50 (Murray [7/8]); a breakout above would confirm the trend’s continuation toward 5000.00 (Murray [8/8]) and 5625.00 (Murray [+2/8]).
Technical indicators support the broader bullish bias: Bollinger Bands are still sloping upward, Stochastic is pointing down but nearing oversold territory, and MACD is easing though still negative, suggesting a possible rebound ahead.
Support and Resistance
Resistance: 4687.50, 5000.00, 5625.00
Support: 4062.50, 3335.00, 2812.50
Trading Scenarios
Main scenario: Buy stop above 4690.00, targeting 5000.00 and 5625.00, with stop-loss at 4470.00. Horizon: 5–7 days.
Alternative scenario: Buy limit near 4062.50, targeting 5000.00 and 5625.00, with stop-loss at 3700.00. Horizon: 5–7 days.
Key Levels
2812.50, 3335.00, 4062.50, 4687.50, 5000.00, 5625.00