

The rebound in the “digital gold,” as well as in the broader crypto market, was short-lived: BTC failed to secure a foothold above 91,000.00 and has resumed its decline today, trading around 86,500.00, with the world’s leading token losing more than 5.0% in value. Analysts have no single view on the trigger behind the sell-off, but it was most likely driven by technical factors. The initial liquidation of several large positions triggered a domino effect, bringing total liquidations to roughly 646.0 million US dollars, about 90.0% of which were long positions.
Additional pressure came from the hack of the DeFi platform Yearn Finance and a renewed confirmation from Chinese authorities of a full ban on cryptocurrencies in the country. The Yearn Finance team reported an incident in which attackers managed to steal around 9.0 million US dollars in assets, with 1,000 ETH (about 3.0 million US dollars) already routed through the Tornado Cash mixer. Meanwhile, the People’s Bank of China stated over the weekend that virtual currencies do not have the status of legal tender and cannot be used in the marketplace. Officials added that they will continue to clamp down on illegal financial activities involving cryptocurrencies.
Support and resistance levels
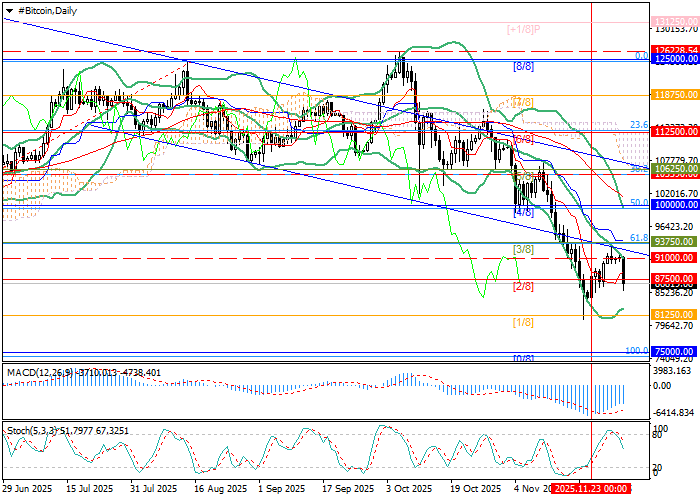
The price reversed from the middle Bollinger Band near 91,000.00 and is now attempting to consolidate below 87,500.00 (Murray level [2/8]) to extend the decline toward 81,250.00 (Murray level [1/8]) and 75,000.00 (Murray level [0/8]). A breakout above 93,750.00 (Murray level [3/8], 61.8% Fibonacci correction) would open the way for renewed growth toward 100,000.00 (Murray level [4/8], 50.0% Fibonacci correction) and 106,250.00 (Murray level [5/8]), but this scenario currently looks less likely.
Technical indicators still point to a bearish trend: Bollinger Bands and the Stochastic oscillator are directed downward, while MACD remains stable in negative territory.
Resistance levels: 93,750.00, 100,000.00, 106,250.00.
Support levels: 87,500.00, 81,250.00, 75,000.00.
BTC/USD trading scenarios and outlook
Short positions may be considered from 85,800.00 with targets at 81,250.00 and 75,000.00, and a stop-loss at 89,100.00. Estimated holding period: 5–7 days.
Long positions may be considered on a breakout above 93,750.00 with targets at 100,000.00 and 106,250.00 and a stop-loss at 88,400.00.
Scenario
| Timeframe | Weekly |
| Recommendation | SELL STOP |
| Entry point | 85,800.00 |
| Take Profit | 81,250.00, 75,000.00 |
| Stop Loss | 89,100.00 |
| Key levels | 75,000.00, 81,250.00, 87,500.00, 93,750.00, 100,000.00, 106,250.00 |
Alternative scenario
| Recommendation | BUY STOP |
| Entry point | 93,800.00 |
| Take Profit | 100,000.00, 106,250.00 |
| Stop Loss | 88,400.00 |
| Key levels | 75,000.00, 81,250.00, 87,500.00, 93,750.00, 100,000.00, 106,250.00 |
